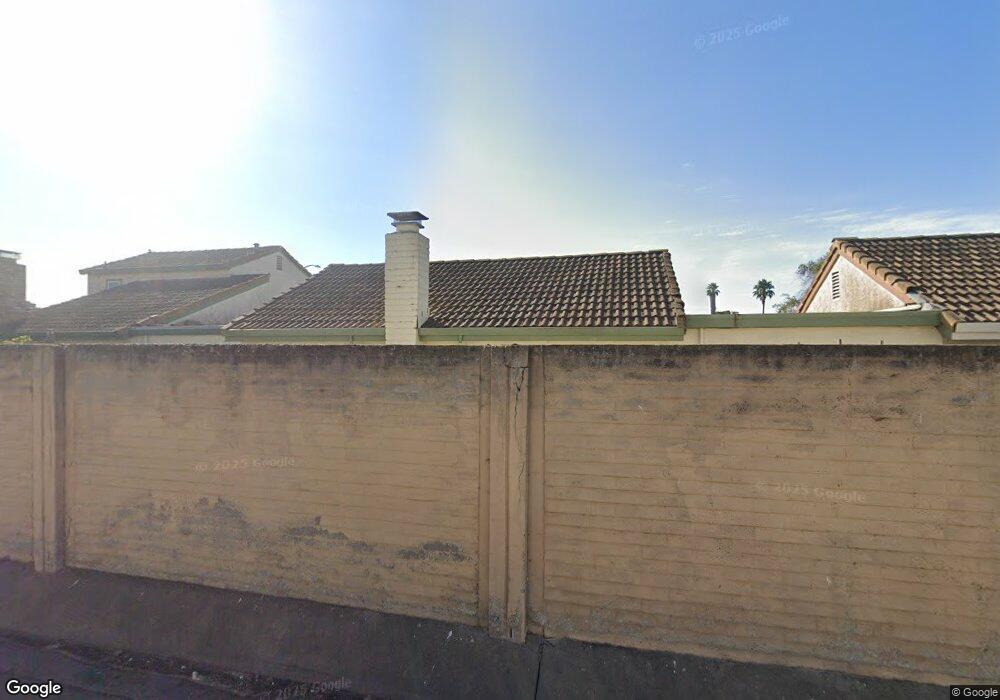
836 Howe Dr Salinas, CA 93907
Boronda NeighborhoodEstimated Value: $511,430 - $609,000
2
Beds
1
Bath
985
Sq Ft
$564/Sq Ft
Est. Value
About This Home
This home is located at 836 Howe Dr, Salinas, CA 93907 and is currently estimated at $555,108, approximately $563 per square foot. 836 Howe Dr is a home located in Monterey County with nearby schools including Laurel Wood Elementary School, Roosevelt Elementary School, and Washington Middle School.
Ownership History
Date
Name
Owned For
Owner Type
Purchase Details
Closed on
Nov 22, 2019
Sold by
Sandoval Eric J and Sandoval Cheryl Lynn
Bought by
Sandoval Eric J and Sandoval Cheryl Lynn
Current Estimated Value
Home Financials for this Owner
Home Financials are based on the most recent Mortgage that was taken out on this home.
Original Mortgage
$183,000
Outstanding Balance
$142,427
Interest Rate
3.6%
Estimated Equity
$412,681
Purchase Details
Closed on
Feb 13, 2003
Sold by
Davidson Bruce B and Davidson Dora Elaine
Bought by
Sandoval Eric J and Sandoval Cheryl
Home Financials for this Owner
Home Financials are based on the most recent Mortgage that was taken out on this home.
Original Mortgage
$212,000
Interest Rate
4.62%
Create a Home Valuation Report for This Property
The Home Valuation Report is an in-depth analysis detailing your home's value as well as a comparison with similar homes in the area
Home Values in the Area
Average Home Value in this Area
Purchase History
| Date | Buyer | Sale Price | Title Company |
|---|---|---|---|
| Sandoval Eric J | -- | Pacific Coast Title Company | |
| Sandoval Eric J | $265,000 | Old Republic Title |
Source: Public Records
Mortgage History
| Date | Status | Borrower | Loan Amount |
|---|---|---|---|
| Open | Sandoval Eric J | $183,000 | |
| Previous Owner | Sandoval Eric J | $212,000 | |
| Closed | Sandoval Eric J | $26,500 |
Source: Public Records
Tax History
| Year | Tax Paid | Tax Assessment Tax Assessment Total Assessment is a certain percentage of the fair market value that is determined by local assessors to be the total taxable value of land and additions on the property. | Land | Improvement |
|---|---|---|---|---|
| 2025 | $4,417 | $383,801 | $238,973 | $144,828 |
| 2024 | $4,417 | $376,277 | $234,288 | $141,989 |
| 2023 | $4,268 | $368,900 | $229,695 | $139,205 |
| 2022 | $4,109 | $361,668 | $225,192 | $136,476 |
| 2021 | $3,947 | $354,577 | $220,777 | $133,800 |
| 2020 | $3,838 | $350,943 | $218,514 | $132,429 |
| 2019 | $3,810 | $344,063 | $214,230 | $129,833 |
| 2018 | $3,762 | $337,318 | $210,030 | $127,288 |
| 2017 | $3,521 | $309,000 | $192,000 | $117,000 |
| 2016 | $3,420 | $294,000 | $183,000 | $111,000 |
| 2015 | $3,184 | $267,000 | $166,000 | $101,000 |
| 2014 | $2,471 | $217,000 | $135,000 | $82,000 |
Source: Public Records
Map
Nearby Homes
Your Personal Tour Guide
Ask me questions while you tour the home.