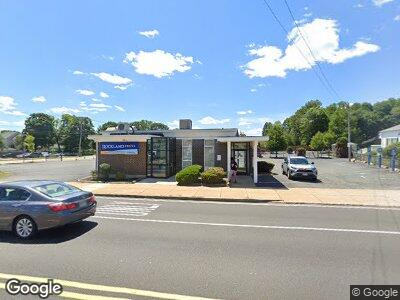
836 N Main St Brockton, MA 02301
Estimated Value: $718,959
4
Beds
2
Baths
2,064
Sq Ft
$348/Sq Ft
Est. Value
About This Home
This home is located at 836 N Main St, Brockton, MA 02301 and is currently estimated at $718,959, approximately $348 per square foot. 836 N Main St is a home located in Plymouth County with nearby schools including Raymond K-8 Elementary School, Louis F Angelo Elementary School, and Manthala George Jr. School.
Ownership History
Date
Name
Owned For
Owner Type
Purchase Details
Closed on
Nov 27, 2019
Sold by
Tau Northeast Llc
Bought by
Waitt & Belcher Rt
Current Estimated Value
Purchase Details
Closed on
May 5, 2008
Sold by
Rockland Trust Co
Bought by
Arc Rock17ma Llc
Home Financials for this Owner
Home Financials are based on the most recent Mortgage that was taken out on this home.
Original Mortgage
$9,999,999
Interest Rate
5.99%
Mortgage Type
Commercial
Purchase Details
Closed on
Aug 9, 2000
Sold by
Nb Fleet
Bought by
Rockland Trust Co
Create a Home Valuation Report for This Property
The Home Valuation Report is an in-depth analysis detailing your home's value as well as a comparison with similar homes in the area
Home Values in the Area
Average Home Value in this Area
Purchase History
| Date | Buyer | Sale Price | Title Company |
|---|---|---|---|
| Waitt & Belcher Rt | $475,000 | None Available | |
| Arc Rock17ma Llc | $623,438 | -- | |
| Rockland Trust Co | $225,000 | -- |
Source: Public Records
Mortgage History
| Date | Status | Borrower | Loan Amount |
|---|---|---|---|
| Previous Owner | Rockland Trust Co | $9,999,999 |
Source: Public Records
Tax History Compared to Growth
Tax History
| Year | Tax Paid | Tax Assessment Tax Assessment Total Assessment is a certain percentage of the fair market value that is determined by local assessors to be the total taxable value of land and additions on the property. | Land | Improvement |
|---|---|---|---|---|
| 2025 | $13,961 | $576,900 | $230,100 | $346,800 |
| 2024 | $13,874 | $576,900 | $209,200 | $367,700 |
| 2023 | $13,645 | $524,400 | $181,500 | $342,900 |
| 2022 | $13,397 | $475,400 | $181,500 | $293,900 |
| 2021 | $13,445 | $453,600 | $172,900 | $280,700 |
| 2020 | $13,794 | $453,600 | $164,600 | $289,000 |
| 2019 | $2,410 | $433,700 | $164,600 | $269,100 |
| 2018 | $13,687 | $424,400 | $164,600 | $259,800 |
| 2017 | $13,687 | $415,500 | $164,600 | $250,900 |
| 2016 | $12,635 | $394,600 | $164,630 | $229,970 |
| 2015 | $13,369 | $394,600 | $164,630 | $229,970 |
| 2014 | $13,401 | $394,600 | $164,630 | $229,970 |
Source: Public Records
Map
Nearby Homes
- 25 Martland Ave
- 33 Field St
- 27 Livingston Rd
- 911 N Main St
- 84 Oak St
- 770 N Montello St Unit 7
- 28 Newton Ave
- 11 Winsten St
- 21 Glendale St
- 221 Oak St Unit 2-23
- 221 Oak St Unit 5-15
- 29 Intervale St
- 37 Frances St
- 31 Bunker Ave
- 115 Ames St
- 16 Olive St
- 41 Woodland Ave
- LOT 0 Bellevue Ave
- 101 Bellevue Ave
- LOT one Arthur St