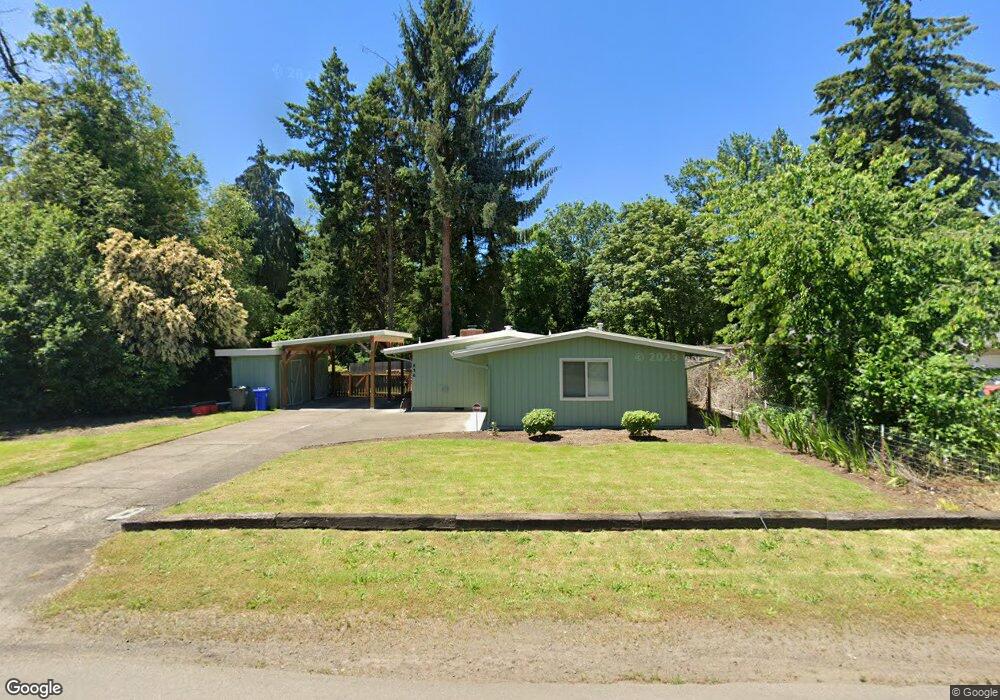
836 N van Duyn St Eugene, OR 97401
Harlow NeighborhoodEstimated Value: $420,489 - $456,000
2
Beds
1
Bath
1,350
Sq Ft
$322/Sq Ft
Est. Value
About This Home
This home is located at 836 N van Duyn St, Eugene, OR 97401 and is currently estimated at $434,372, approximately $321 per square foot. 836 N van Duyn St is a home located in Lane County with nearby schools including Holt Elementary School, Monroe Middle School, and Sheldon High School.
Ownership History
Date
Name
Owned For
Owner Type
Purchase Details
Closed on
Mar 4, 2021
Sold by
Bynum Jerry Edward
Bought by
Doheny Anthony J and Doheny Joan R
Current Estimated Value
Home Financials for this Owner
Home Financials are based on the most recent Mortgage that was taken out on this home.
Original Mortgage
$272,000
Outstanding Balance
$242,718
Interest Rate
2.7%
Mortgage Type
New Conventional
Estimated Equity
$191,654
Purchase Details
Closed on
Feb 25, 2021
Sold by
Parrott Twila Maye and Estate Of Jerry Edward Bynum
Bought by
Doheny Anthony J and Doheny Joan R
Home Financials for this Owner
Home Financials are based on the most recent Mortgage that was taken out on this home.
Original Mortgage
$272,000
Outstanding Balance
$242,718
Interest Rate
2.7%
Mortgage Type
New Conventional
Estimated Equity
$191,654
Purchase Details
Closed on
Jul 14, 1999
Sold by
Gloria Storms
Bought by
Bynum Jerry E
Home Financials for this Owner
Home Financials are based on the most recent Mortgage that was taken out on this home.
Original Mortgage
$102,300
Interest Rate
7.4%
Create a Home Valuation Report for This Property
The Home Valuation Report is an in-depth analysis detailing your home's value as well as a comparison with similar homes in the area
Home Values in the Area
Average Home Value in this Area
Purchase History
| Date | Buyer | Sale Price | Title Company |
|---|---|---|---|
| Doheny Anthony J | $320,000 | None Listed On Document | |
| Doheny Anthony J | $320,500 | None Available | |
| Bynum Jerry E | $127,900 | Cascade Title Co |
Source: Public Records
Mortgage History
| Date | Status | Borrower | Loan Amount |
|---|---|---|---|
| Open | Doheny Anthony J | $272,000 | |
| Closed | Doheny Anthony J | $272,000 | |
| Previous Owner | Bynum Jerry E | $102,300 |
Source: Public Records
Tax History
| Year | Tax Paid | Tax Assessment Tax Assessment Total Assessment is a certain percentage of the fair market value that is determined by local assessors to be the total taxable value of land and additions on the property. | Land | Improvement |
|---|---|---|---|---|
| 2025 | $3,900 | $200,164 | -- | -- |
| 2024 | $3,851 | $194,334 | -- | -- |
| 2023 | $3,851 | $188,674 | -- | -- |
| 2022 | $3,608 | $183,179 | $0 | $0 |
| 2021 | $3,389 | $177,844 | $0 | $0 |
| 2020 | $3,401 | $172,665 | $0 | $0 |
| 2019 | $3,285 | $167,636 | $0 | $0 |
| 2018 | $3,092 | $158,014 | $0 | $0 |
| 2017 | $2,953 | $158,014 | $0 | $0 |
| 2016 | $2,852 | $153,412 | $0 | $0 |
| 2015 | $2,736 | $148,944 | $0 | $0 |
| 2014 | $2,658 | $144,606 | $0 | $0 |
Source: Public Records
Map
Nearby Homes
- 825 Waverly St
- 2872 Suffolk Ct
- 2994 Dapple Way
- 280 Roan Dr
- 1271 Arcadia Dr
- 2746 Harlow Rd
- 3700 Babcock Ln Unit 106
- 280 Regal Ct
- 600 Cherry Dr Unit 8
- 600 Cherry Dr Unit 3
- 950 Coburg Rd
- 1491 Victorian Way
- 2345 Pioneer Pike
- 0 Sprig Ln Unit Lot 3
- 0 Sprig Ln Unit Lot 3 766109892
- 394 Cherry Dr
- 2746 Norbert Ln
- 1564 Regency Dr
- 327 Rustic Place Unit 35
- 2956 Willakenzie Rd
- 887 N van Duyn St
- 835 N van Duyn St
- 882 N van Duyn St
- 835 Randall St
- 873 Randall St
- 885 Randall St
- 876 N van Duyn St
- 798 N van Duyn St
- 815 N van Duyn St
- 793 Randall St
- 925 Randall St
- 797 N van Duyn St
- 895 N van Duyn St
- 914 N van Duyn St
- 926 N van Duyn St
- 781 Randall St
- 780 N van Duyn St
- 913 N van Duyn St
- 808 Waverly St
- 840 Waverly St
Your Personal Tour Guide
Ask me questions while you tour the home.