


836 S Spring Rd Elmhurst, IL 60126
4
Beds
3
Baths
2,312
Sq Ft
6,098
Sq Ft Lot
Highlights
- Deck
- Vaulted Ceiling
- Skylights
- Jackson Elementary School Rated A
- Main Floor Bedroom
- Soaking Tub
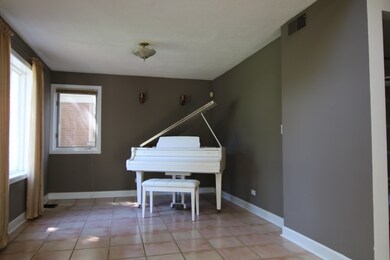
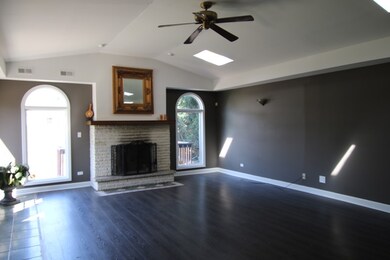
About This Home
As of October 2024Elmhurst Best Priced 4 Bedroom and 3 Full Baths "Schools Wow" Exciting home Boasting over 2300 SQ FT, Walk to Eldridge Park, Sought after Jackson, Bryan & York High School! 2 story foyer leading into Kitchen and 25 X 19 Great Room with skylights, vaulted ceilings and wood burning fireplace. Eat-in kitchen with granite counter tops and breakfast bar leading to a huge dining room with crown molding. Large Master Bedroom & Master Bath with vaulted ceilings, separate shower and Oceania tub. New vanity with marble top. 1st Floor Bedroom & Full Bathroom for in-law arrangement. Large fenced in backyard with a patio and deck combo. A must see for Elmhurst.....
Last Agent to Sell the Property
Charles Rutenberg Realty of IL License #475100464 Listed on: 10/09/2016
Home Details
Home Type
- Single Family
Est. Annual Taxes
- $9,772
Home Design
- Brick Exterior Construction
- Asphalt Shingled Roof
Interior Spaces
- Vaulted Ceiling
- Skylights
- Wood Burning Fireplace
- Entrance Foyer
- Laundry on main level
Kitchen
- Breakfast Bar
- Oven or Range
- Dishwasher
Bedrooms and Bathrooms
- Main Floor Bedroom
- Primary Bathroom is a Full Bathroom
- Bathroom on Main Level
- Soaking Tub
- Separate Shower
Parking
- Parking Available
- Driveway
- Parking Included in Price
Outdoor Features
- Deck
- Patio
Location
- Property is near a bus stop
Utilities
- Forced Air Heating and Cooling System
- Lake Michigan Water
Listing and Financial Details
- Homeowner Tax Exemptions
- $7,500 Seller Concession
Ownership History
Date
Name
Owned For
Owner Type
Purchase Details
Listed on
Jun 27, 2024
Closed on
Oct 21, 2024
Sold by
Oyesiku Imuentiyan F and Oyesiku Olukoyejo
Bought by
Kamble Smita
Seller's Agent
Christopher Herrera
REMAX Legends
Buyer's Agent
Tom George
Discover Real Estate
List Price
$559,999
Sold Price
$465,000
Premium/Discount to List
-$94,999
-16.96%
Total Days on Market
21
Views
255
Current Estimated Value
Home Financials for this Owner
Home Financials are based on the most recent Mortgage that was taken out on this home.
Estimated Appreciation
$60,705
Avg. Annual Appreciation
16.18%
Original Mortgage
$451,050
Outstanding Balance
$448,817
Interest Rate
6.08%
Mortgage Type
New Conventional
Estimated Equity
$73,884
Purchase Details
Listed on
Oct 9, 2016
Closed on
Dec 20, 2016
Sold by
Passaris Mary Lou
Bought by
Oyesiku Imuentiyan F
Seller's Agent
Frank Kresz
Charles Rutenberg Realty of IL
Buyer's Agent
Ruth Ramos
United Real Estate - Chicago
List Price
$319,000
Sold Price
$288,000
Premium/Discount to List
-$31,000
-9.72%
Home Financials for this Owner
Home Financials are based on the most recent Mortgage that was taken out on this home.
Avg. Annual Appreciation
6.30%
Original Mortgage
$278,388
Interest Rate
3.25%
Mortgage Type
FHA
Similar Homes in Elmhurst, IL
Create a Home Valuation Report for This Property
The Home Valuation Report is an in-depth analysis detailing your home's value as well as a comparison with similar homes in the area
Home Values in the Area
Average Home Value in this Area
Purchase History
| Date | Type | Sale Price | Title Company |
|---|---|---|---|
| Warranty Deed | $465,000 | None Listed On Document | |
| Warranty Deed | $288,000 | Fidelity National Title |
Source: Public Records
Mortgage History
| Date | Status | Loan Amount | Loan Type |
|---|---|---|---|
| Open | $451,050 | New Conventional | |
| Previous Owner | $312,000 | New Conventional | |
| Previous Owner | $301,180 | FHA | |
| Previous Owner | $278,388 | FHA | |
| Previous Owner | $199,500 | Stand Alone Refi Refinance Of Original Loan | |
| Previous Owner | $200,000 | Credit Line Revolving | |
| Previous Owner | $35,000 | Unknown | |
| Previous Owner | $1,200,000 | Unknown | |
| Previous Owner | $25,000 | Credit Line Revolving | |
| Previous Owner | $30,000 | Unknown | |
| Previous Owner | $2,400,000 | Unknown | |
| Previous Owner | $1,300,000 | Unknown | |
| Previous Owner | $175,000 | Unknown |
Source: Public Records
Property History
| Date | Event | Price | Change | Sq Ft Price |
|---|---|---|---|---|
| 10/21/2024 10/21/24 | Sold | $465,000 | -2.1% | $176 / Sq Ft |
| 09/23/2024 09/23/24 | Pending | -- | -- | -- |
| 08/20/2024 08/20/24 | Price Changed | $475,000 | -4.0% | $180 / Sq Ft |
| 08/02/2024 08/02/24 | Price Changed | $495,000 | -2.9% | $188 / Sq Ft |
| 06/27/2024 06/27/24 | Price Changed | $510,000 | -8.9% | $193 / Sq Ft |
| 04/29/2024 04/29/24 | For Sale | $559,999 | +94.4% | $212 / Sq Ft |
| 12/20/2016 12/20/16 | Sold | $288,000 | -3.7% | $125 / Sq Ft |
| 10/30/2016 10/30/16 | Pending | -- | -- | -- |
| 10/14/2016 10/14/16 | Price Changed | $299,000 | -6.3% | $129 / Sq Ft |
| 10/09/2016 10/09/16 | For Sale | $319,000 | -- | $138 / Sq Ft |
Source: Midwest Real Estate Data (MRED)
Tax History Compared to Growth
Tax History
| Year | Tax Paid | Tax Assessment Tax Assessment Total Assessment is a certain percentage of the fair market value that is determined by local assessors to be the total taxable value of land and additions on the property. | Land | Improvement |
|---|---|---|---|---|
| 2023 | $9,772 | $168,960 | $56,520 | $112,440 |
| 2022 | $9,485 | $162,420 | $54,330 | $108,090 |
| 2021 | $9,249 | $158,380 | $52,980 | $105,400 |
| 2020 | $8,891 | $154,910 | $51,820 | $103,090 |
| 2019 | $8,702 | $147,280 | $49,270 | $98,010 |
| 2018 | $7,683 | $130,010 | $46,630 | $83,380 |
| 2017 | $7,511 | $123,880 | $44,430 | $79,450 |
| 2016 | $7,349 | $116,710 | $41,860 | $74,850 |
| 2015 | $7,271 | $108,730 | $39,000 | $69,730 |
| 2014 | $9,108 | $124,190 | $35,610 | $88,580 |
| 2013 | $9,009 | $125,940 | $36,110 | $89,830 |
Source: Public Records
Agents Affiliated with this Home
-
C
Seller's Agent in 2024
Christopher Herrera
RE/MAX
-
T
Buyer's Agent in 2024
Tom George
Discover Real Estate
-
F
Seller's Agent in 2016
Frank Kresz
Charles Rutenberg Realty of IL
-
R
Buyer's Agent in 2016
Ruth Ramos
United Real Estate - Chicago
Map
Source: Midwest Real Estate Data (MRED)
MLS Number: MRD09362778
APN: 06-14-113-015
Disclaimer: Certain information contained herein is derived from information provided by parties other than Homes.com. All information provided is deemed reliable, but is not guaranteed to be accurate and should be independently verified.
![]() Based on information submitted to the MLS GRID. All data is obtained from various sources and may not have been verified by broker or MLS GRID. Supplied Open House Information is subject to change without notice. All information should be independently reviewed and verified for accuracy. Properties may or may not be listed by the office/agent presenting the information. Some IDX listings have been excluded from this website.
Based on information submitted to the MLS GRID. All data is obtained from various sources and may not have been verified by broker or MLS GRID. Supplied Open House Information is subject to change without notice. All information should be independently reviewed and verified for accuracy. Properties may or may not be listed by the office/agent presenting the information. Some IDX listings have been excluded from this website.
The Digital Millennium Copyright Act of 1998, 17 U.S.C. § 512 (the “DMCA”) provides recourse for copyright owners who believe that material appearing on the Internet infringes their rights under U.S. copyright law. If you believe in good faith that any content or material made available in connection with our website or services infringes your copyright, you (or your agent) may send us a notice requesting that the content or material be removed, or access to it blocked.
Notices must be sent in writing by email to DMCAnotice@MLSGrid.com.
The DMCA requires that your notice of alleged copyright infringement include the following information:
(1) description of the copyrighted work that is the subject of claimed infringement;
(2) description of the alleged infringing content and information sufficient to permit us to locate the content;
(3) contact information for you, including your address, telephone number and email address;
(4) a statement by you that you have a good faith belief that the content in the manner complained of is not authorized by the copyright owner, or its agent, or by the operation of any law;
(5) a statement by you, signed under penalty of perjury, that the information in the notification is accurate and that you have the authority to enforce the copyrights that are claimed to be infringed; and
(6) a physical or electronic signature of the copyright owner or a person authorized to act on the copyright owner’s behalf. Failure to include all of the above information may result in the delay of the processing of your complaint.
Nearby Homes
- 797 S Spring Rd
- 901 S Fairfield Ave
- 814 S Hawthorne Ave
- 735 S Spring Rd
- 728 S Hillside Ave
- 957 S Hillside Ave
- 732 S Mitchell Ave
- 936 S Mitchell Ave
- 425 W Madison St
- 740 S Berkley Ave
- 895 S Parkside Ave
- 729 S Fairview Ave
- 663 S Hawthorne Ave
- 670 S Parkside Ave
- 717 S Washington St
- 618 S Swain Ave
- 236 W Crescent Ave
- 611 S Prospect Ave
- 650 E Van Buren St
- 162 E Hale St