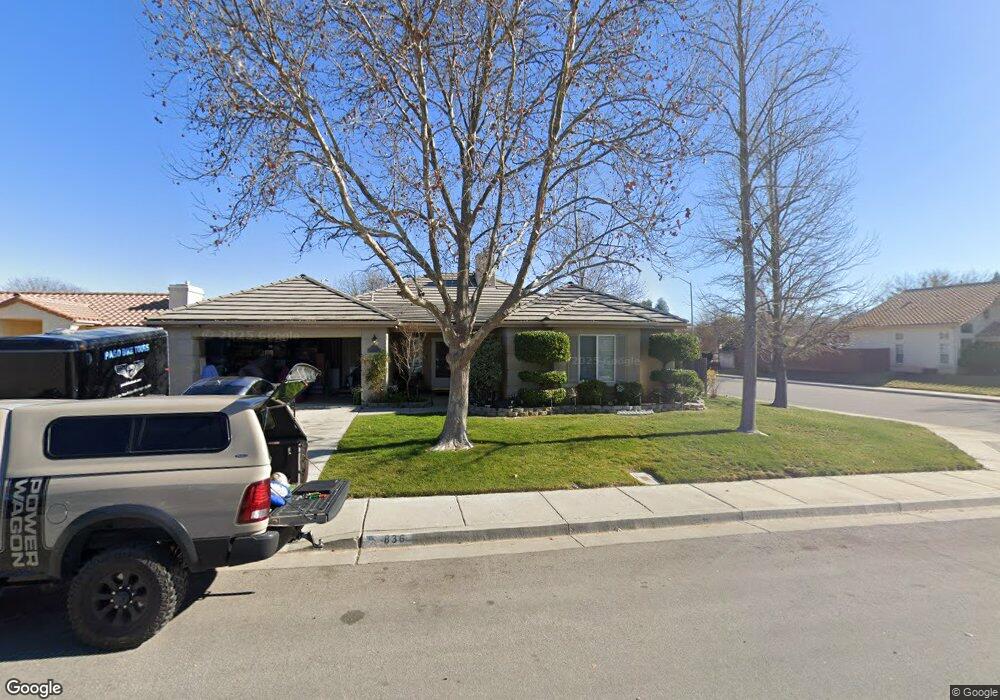
836 Sycamore Canyon Rd Paso Robles, CA 93446
Estimated Value: $698,305 - $772,000
3
Beds
2
Baths
1,681
Sq Ft
$437/Sq Ft
Est. Value
About This Home
This home is located at 836 Sycamore Canyon Rd, Paso Robles, CA 93446 and is currently estimated at $735,076, approximately $437 per square foot. 836 Sycamore Canyon Rd is a home located in San Luis Obispo County with nearby schools including Virginia Peterson Elementary School, Daniel Lewis Middle School, and Paso Robles High School.
Ownership History
Date
Name
Owned For
Owner Type
Purchase Details
Closed on
Aug 19, 2014
Sold by
Caruana Bryan P and Caruana Debra L
Bought by
Bryan & Debra Caruana Family Trust and Caruana Debra L
Current Estimated Value
Home Financials for this Owner
Home Financials are based on the most recent Mortgage that was taken out on this home.
Original Mortgage
$192,000
Interest Rate
4.1%
Mortgage Type
New Conventional
Purchase Details
Closed on
Jun 8, 2005
Sold by
Caruana Bryan Paul and Caruana Debra Lynn
Bought by
Caruana Bryan P and Caruana Debra L
Purchase Details
Closed on
Jan 26, 1999
Sold by
Priske Jones Ventures/Meadowlark I Llc
Bought by
Caruana Bryan Paul and Caruana Debra Lynn
Home Financials for this Owner
Home Financials are based on the most recent Mortgage that was taken out on this home.
Original Mortgage
$145,900
Interest Rate
6.63%
Create a Home Valuation Report for This Property
The Home Valuation Report is an in-depth analysis detailing your home's value as well as a comparison with similar homes in the area
Home Values in the Area
Average Home Value in this Area
Purchase History
| Date | Buyer | Sale Price | Title Company |
|---|---|---|---|
| Bryan & Debra Caruana Family Trust | -- | Accommodation | |
| Caruana Bryan P | -- | Fidelity National Title Co | |
| Caruana Bryan P | -- | -- | |
| Caruana Bryan Paul | $183,000 | First American Title Co |
Source: Public Records
Mortgage History
| Date | Status | Borrower | Loan Amount |
|---|---|---|---|
| Closed | Caruana Bryan P | $192,000 | |
| Closed | Caruana Bryan Paul | $145,900 |
Source: Public Records
Tax History Compared to Growth
Tax History
| Year | Tax Paid | Tax Assessment Tax Assessment Total Assessment is a certain percentage of the fair market value that is determined by local assessors to be the total taxable value of land and additions on the property. | Land | Improvement |
|---|---|---|---|---|
| 2025 | $4,424 | $396,571 | $94,049 | $302,522 |
| 2024 | $4,354 | $388,796 | $92,205 | $296,591 |
| 2023 | $4,354 | $381,174 | $90,398 | $290,776 |
| 2022 | $4,290 | $373,701 | $88,626 | $285,075 |
| 2021 | $4,219 | $366,375 | $86,889 | $279,486 |
| 2020 | $4,163 | $362,620 | $85,999 | $276,621 |
| 2019 | $4,105 | $355,511 | $84,313 | $271,198 |
| 2018 | $4,051 | $348,541 | $82,660 | $265,881 |
| 2017 | $3,815 | $341,708 | $81,040 | $260,668 |
| 2016 | $3,742 | $335,008 | $79,451 | $255,557 |
| 2015 | $3,730 | $329,977 | $78,258 | $251,719 |
| 2014 | $3,605 | $323,515 | $76,726 | $246,789 |
Source: Public Records
Map
Nearby Homes
- 830 Sycamore Canyon Rd
- 611 Larkfield Place
- 902 Sycamore Canyon Rd
- 5185 Airport Rd
- 505 Creekside Ct
- 1840 Ponderosa Ln
- 1927 Fieldstone Cir
- 1835 Ponderosa Ln
- 1823 Kimberly Dr
- 3730 Rosado Rd
- 1324 Cava Rd
- 1313 Cava Rd
- 1319 Cava Rd
- 1325 Cava Rd
- 1719 Lark Ellen Dr
- 324 Cool Valley Dr
- 3718 Rhone Rd
- 1951 Tulipwood Dr
- 3706 Rhone Rd
- 1615 Poppy Ln
- 834 Sycamore Canyon Rd
- 840 Sycamore Canyon Rd
- 837 Sycamore Canyon Rd
- 902 Running Stag Way
- 832 Sycamore Canyon Rd Unit L280
- 832 Sycamore Canyon Rd
- 842 Sycamore Canyon Rd
- 2409 Winding Brook Rd
- 835 Sycamore Canyon Rd
- 2407 Winding Brook Rd
- 2411 Winding Brook Rd
- 830 Sycamore Canyon Rd Unit L279
- 942 Running Stag Way
- 846 Sycamore Canyon Rd
- 904 Running Stag Way
- 901 Running Stag Way
- 833 Sycamore Canyon Rd
- 2405 Winding Brook Rd
- 2413 Winding Brook Rd
- 829 Sycamore Canyon Rd Unit L281