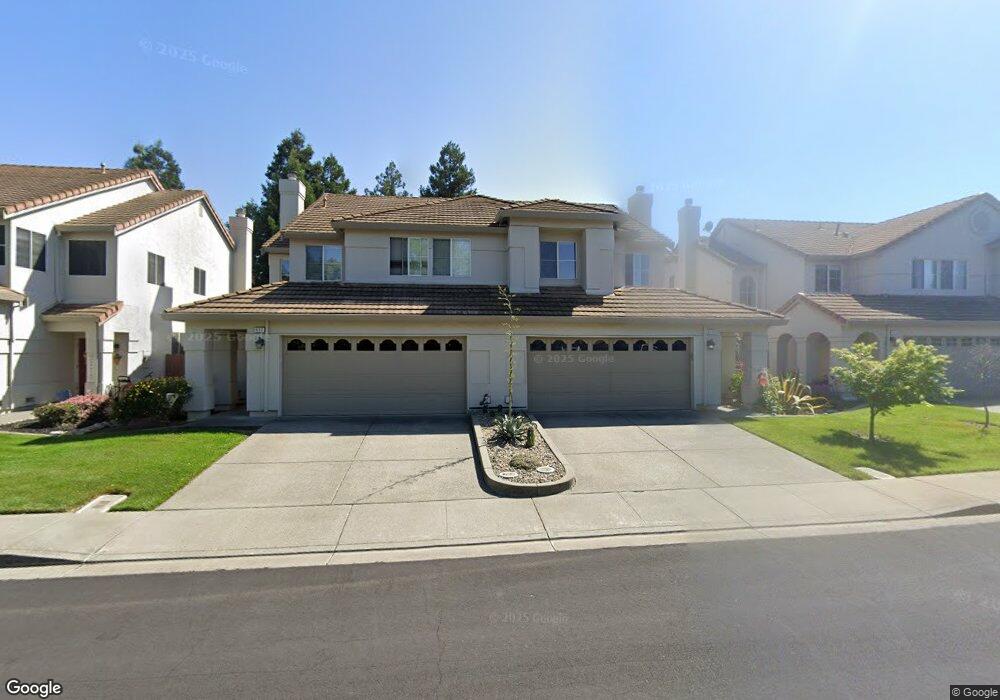
836 Syracuse Dr Vacaville, CA 95687
Estimated Value: $512,750 - $545,000
3
Beds
3
Baths
1,528
Sq Ft
$342/Sq Ft
Est. Value
About This Home
This home is located at 836 Syracuse Dr, Vacaville, CA 95687 and is currently estimated at $522,688, approximately $342 per square foot. 836 Syracuse Dr is a home located in Solano County with nearby schools including Cooper Elementary School, Orchard Elementary School, and Vaca Pena Middle School.
Ownership History
Date
Name
Owned For
Owner Type
Purchase Details
Closed on
May 4, 2020
Sold by
Karse Sandra Lynn
Bought by
Karse Sandra L and The Sandra L Karse Living Trus
Current Estimated Value
Purchase Details
Closed on
May 11, 2011
Sold by
Garland Joanna
Bought by
Karse Sandra Lynn
Home Financials for this Owner
Home Financials are based on the most recent Mortgage that was taken out on this home.
Original Mortgage
$148,000
Outstanding Balance
$102,663
Interest Rate
4.84%
Mortgage Type
New Conventional
Estimated Equity
$420,025
Purchase Details
Closed on
Mar 19, 2003
Sold by
Scalise Katherine
Bought by
Garland Joanna
Home Financials for this Owner
Home Financials are based on the most recent Mortgage that was taken out on this home.
Original Mortgage
$261,308
Interest Rate
5.82%
Mortgage Type
FHA
Purchase Details
Closed on
Oct 6, 1997
Sold by
Western & California Ltd
Bought by
Scalise Katherine
Create a Home Valuation Report for This Property
The Home Valuation Report is an in-depth analysis detailing your home's value as well as a comparison with similar homes in the area
Home Values in the Area
Average Home Value in this Area
Purchase History
| Date | Buyer | Sale Price | Title Company |
|---|---|---|---|
| Karse Sandra L | -- | None Available | |
| Karse Sandra Lynn | $185,000 | First American Title Company | |
| Garland Joanna | $265,000 | Fidelity Title Co | |
| Scalise Katherine | $120,000 | Frontier Title Company |
Source: Public Records
Mortgage History
| Date | Status | Borrower | Loan Amount |
|---|---|---|---|
| Open | Karse Sandra Lynn | $148,000 | |
| Previous Owner | Garland Joanna | $261,308 | |
| Closed | Garland Joanna | $12,000 |
Source: Public Records
Tax History Compared to Growth
Tax History
| Year | Tax Paid | Tax Assessment Tax Assessment Total Assessment is a certain percentage of the fair market value that is determined by local assessors to be the total taxable value of land and additions on the property. | Land | Improvement |
|---|---|---|---|---|
| 2025 | $2,854 | $237,005 | $96,082 | $140,923 |
| 2024 | $2,854 | $232,359 | $94,199 | $138,160 |
| 2023 | $2,776 | $227,803 | $92,352 | $135,451 |
| 2022 | $2,720 | $223,338 | $90,542 | $132,796 |
| 2021 | $2,720 | $218,960 | $88,767 | $130,193 |
| 2020 | $2,684 | $216,716 | $87,857 | $128,859 |
| 2019 | $2,638 | $212,468 | $86,135 | $126,333 |
| 2018 | $2,596 | $208,303 | $84,447 | $123,856 |
| 2017 | $2,504 | $204,220 | $82,792 | $121,428 |
| 2016 | $2,483 | $200,217 | $81,169 | $119,048 |
| 2015 | $2,450 | $197,210 | $79,950 | $117,260 |
| 2014 | $2,302 | $193,348 | $78,384 | $114,964 |
Source: Public Records
Map
Nearby Homes
- 725 Wellsey Rd
- 654 Rutgers St
- 1055 Notre Dame Cir
- 309 Regency Cir
- 142 Nantucket Cir
- 313 Toyon Ln
- 725 Arabian Cir
- 420 Temple Dr
- 154 Edwin Dr
- 137 Edwin Dr
- 431 Stanford St
- 512 Oakmeadow Ct
- 755 Oak Hollow Ave
- 113 Asbury Dr
- 190 Huntington Dr
- 124 Dover Way
- 642 White Oak Ln
- 148 Randall Ave
- 1801 Marshall Rd Unit 408
- 1801 Marshall Rd Unit 908