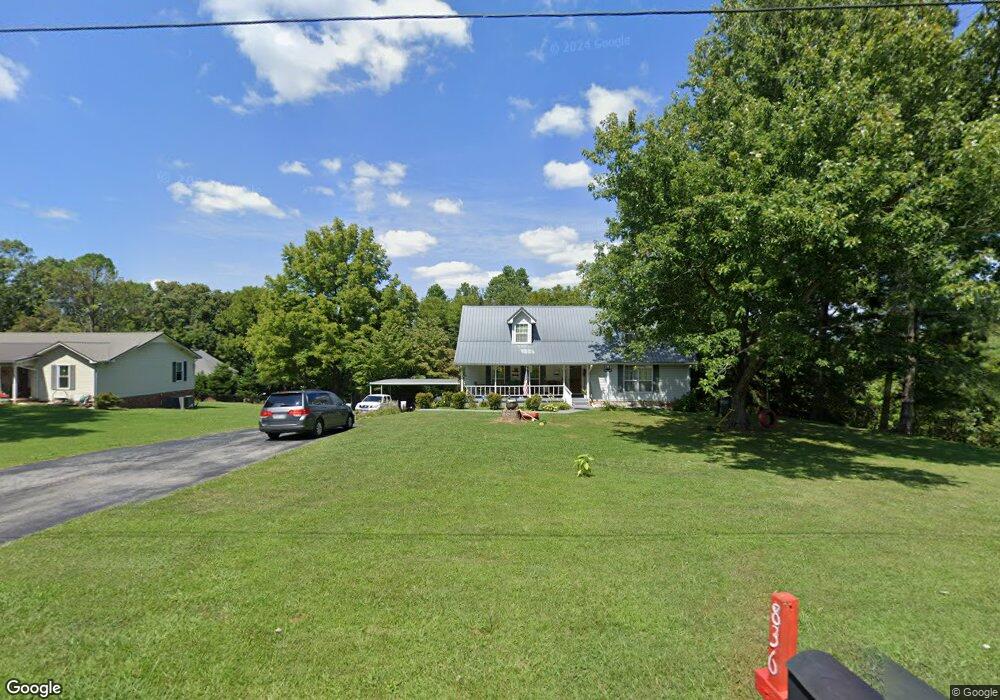
836 Valley View Dr Sparta, TN 38583
Estimated Value: $309,027 - $366,000
--
Bed
3
Baths
2,179
Sq Ft
$155/Sq Ft
Est. Value
About This Home
This home is located at 836 Valley View Dr, Sparta, TN 38583 and is currently estimated at $337,257, approximately $154 per square foot. 836 Valley View Dr is a home located in White County with nearby schools including Findlay Elementary School, White County Middle School, and White County High School.
Ownership History
Date
Name
Owned For
Owner Type
Purchase Details
Closed on
Mar 27, 2019
Sold by
Gribble Wanda Gail Brock and Gribble Wanda Gail Brock
Bought by
Jones Tiffany C and Daniels Chandra D
Current Estimated Value
Home Financials for this Owner
Home Financials are based on the most recent Mortgage that was taken out on this home.
Original Mortgage
$29,250
Outstanding Balance
$25,558
Interest Rate
4.3%
Mortgage Type
Commercial
Estimated Equity
$311,699
Purchase Details
Closed on
Jun 26, 2003
Sold by
John Murphy and John Vonetta
Bought by
Brock Vivien J and Lynn Jerry Lynn
Purchase Details
Closed on
Jul 3, 2000
Sold by
Melinda Williams
Bought by
John Murphy and John Vonette
Purchase Details
Closed on
Oct 15, 1993
Sold by
Gary Mcgulley
Bought by
Melinda Williams
Purchase Details
Closed on
Apr 17, 1991
Bought by
Mccully Gary P and Mccully Debbie
Purchase Details
Closed on
Sep 29, 1988
Bought by
Mitchell Stan and Mitchell Sergio J
Create a Home Valuation Report for This Property
The Home Valuation Report is an in-depth analysis detailing your home's value as well as a comparison with similar homes in the area
Home Values in the Area
Average Home Value in this Area
Purchase History
| Date | Buyer | Sale Price | Title Company |
|---|---|---|---|
| Jones Tiffany C | $32,500 | Pointer Title Services | |
| Brock Vivien J | $140,000 | -- | |
| John Murphy | $125,000 | -- | |
| Melinda Williams | $82,000 | -- | |
| Mccully Gary P | $6,000 | -- | |
| Mitchell Stan | -- | -- |
Source: Public Records
Mortgage History
| Date | Status | Borrower | Loan Amount |
|---|---|---|---|
| Open | Jones Tiffany C | $29,250 |
Source: Public Records
Tax History Compared to Growth
Tax History
| Year | Tax Paid | Tax Assessment Tax Assessment Total Assessment is a certain percentage of the fair market value that is determined by local assessors to be the total taxable value of land and additions on the property. | Land | Improvement |
|---|---|---|---|---|
| 2025 | -- | $87,975 | $0 | $0 |
| 2024 | -- | $47,975 | $3,750 | $44,225 |
| 2023 | $1,424 | $47,975 | $3,750 | $44,225 |
| 2022 | $1,424 | $47,975 | $3,750 | $44,225 |
| 2021 | $1,424 | $47,975 | $3,750 | $44,225 |
| 2020 | $1,424 | $47,975 | $3,750 | $44,225 |
| 2019 | $1,166 | $37,625 | $3,750 | $33,875 |
| 2018 | $1,166 | $37,625 | $3,750 | $33,875 |
| 2017 | $1,166 | $37,625 | $3,750 | $33,875 |
| 2016 | $1,166 | $37,625 | $3,750 | $33,875 |
| 2015 | $1,091 | $37,625 | $3,750 | $33,875 |
| 2014 | -- | $37,625 | $3,750 | $33,875 |
| 2013 | -- | $35,750 | $3,750 | $32,000 |
Source: Public Records
Map
Nearby Homes
- 611 Imperial Dr
- 0 Millers Point Rd
- 0 Roberts Matthews Hwy
- 00 Roberts Matthews Hwy
- 731 Howell St
- 00 N Spring St
- 235 Dairy Barn
- 671 N Spring St
- 613 Hale St
- 1644 Walker Cove Rd
- 2 Smithville Hwy
- 1 Smithville Hwy
- 673 Charles Golden Rd
- 936 N Spring St
- 249 N Spring St
- 202 Gillen Dr
- 548 Turntable Rd
- 548 Turn Table Rd
- 210 Gillen Dr
- 0 Moore St
- 842 Valley View Dr
- 864 Valley View Dr
- 861 Valley View Dr
- 867 Valley View Dr
- 849 Valley View Dr
- 855 Valley View Dr
- 853 Valley View Dr
- 0 Mose Dr Unit 171553
- 0 Mose Dr Unit RTC2602613
- 0 Mose Dr Unit 1043124
- 0 Mose Dr Unit 1084901
- 0 Mose Dr Unit 1189507
- 0 Mose Dr Unit RTC2380205
- 0 Mose Dr Unit 1156368
- 403 Mose Dr
- 803 Valley View Dr
- 508 Mose Dr
- 229 Mose Dr
- 706 Kinnard Rd Unit 1000
- 827 Kinnard Rd