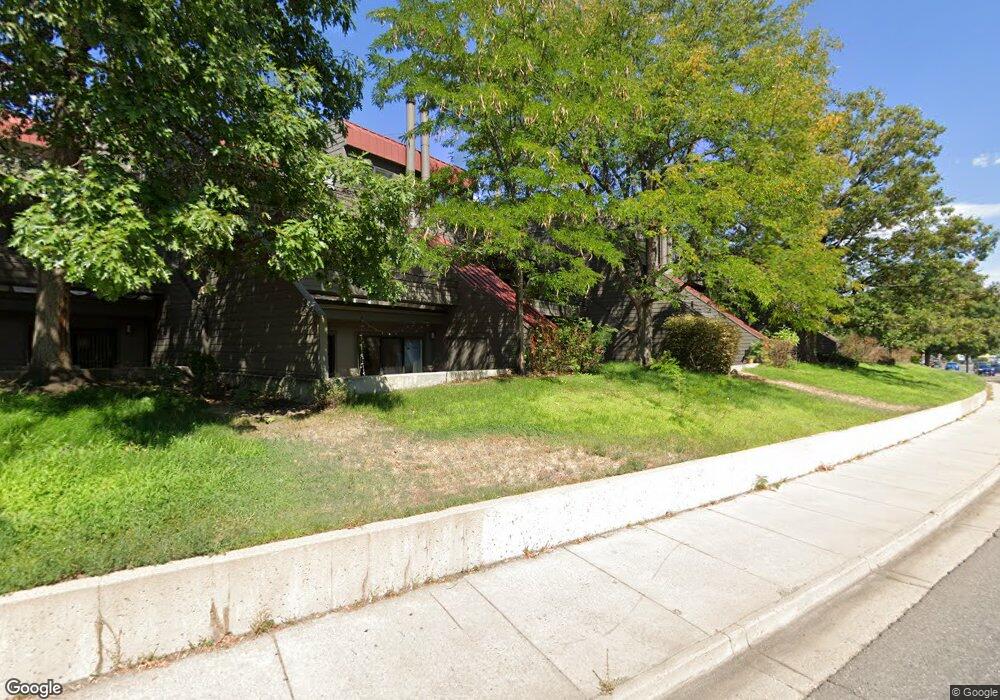
836 Walnut St Unit F Boulder, CO 80302
West Pearl NeighborhoodEstimated Value: $1,019,000 - $1,159,000
3
Beds
3
Baths
1,262
Sq Ft
$852/Sq Ft
Est. Value
About This Home
This home is located at 836 Walnut St Unit F, Boulder, CO 80302 and is currently estimated at $1,074,948, approximately $851 per square foot. 836 Walnut St Unit F is a home located in Boulder County with nearby schools including Whittier Elementary School, Casey Middle School, and Boulder High School.
Ownership History
Date
Name
Owned For
Owner Type
Purchase Details
Closed on
Oct 19, 2018
Sold by
Corona Shauna Gae Sandstead and Corona Emily Jo
Bought by
Sandstead Shauna Gae
Current Estimated Value
Purchase Details
Closed on
Aug 24, 2010
Sold by
Pierce Carla Marie
Bought by
Corona Shauna Gae Sandstead
Purchase Details
Closed on
Aug 22, 2003
Sold by
Pierce Franklin V
Bought by
Adamson Carla Marie Pierce
Purchase Details
Closed on
Jul 12, 2001
Sold by
Pierce A Charles
Bought by
Pierce Franklin Verette
Purchase Details
Closed on
Jul 6, 2001
Sold by
Garza Leslie Anne
Bought by
Pierce A Charles
Purchase Details
Closed on
Jan 18, 2000
Sold by
Pierce Marian Verette
Bought by
Pierce Franklin Verette
Purchase Details
Closed on
Oct 20, 1999
Sold by
Pierce Marian Verette
Bought by
Pierce Franklin Verette
Create a Home Valuation Report for This Property
The Home Valuation Report is an in-depth analysis detailing your home's value as well as a comparison with similar homes in the area
Home Values in the Area
Average Home Value in this Area
Purchase History
| Date | Buyer | Sale Price | Title Company |
|---|---|---|---|
| Sandstead Shauna Gae | -- | None Available | |
| Corona Shauna Gae Sandstead | $460,000 | First Colorado Title | |
| Adamson Carla Marie Pierce | $150,000 | -- | |
| Pierce Franklin Verette | -- | -- | |
| Pierce A Charles | -- | -- | |
| Pierce Franklin Verette | -- | -- | |
| Pierce Franklin Verette | -- | -- |
Source: Public Records
Tax History Compared to Growth
Tax History
| Year | Tax Paid | Tax Assessment Tax Assessment Total Assessment is a certain percentage of the fair market value that is determined by local assessors to be the total taxable value of land and additions on the property. | Land | Improvement |
|---|---|---|---|---|
| 2025 | $6,176 | $64,169 | -- | $64,169 |
| 2024 | $6,176 | $64,169 | -- | $64,169 |
| 2023 | $6,067 | $69,382 | -- | $73,067 |
| 2022 | $5,846 | $62,147 | $0 | $62,147 |
| 2021 | $5,578 | $63,935 | $0 | $63,935 |
| 2020 | $5,586 | $64,171 | $0 | $64,171 |
| 2019 | $5,500 | $64,171 | $0 | $64,171 |
| 2018 | $4,806 | $55,433 | $0 | $55,433 |
| 2017 | $4,656 | $61,284 | $0 | $61,284 |
| 2016 | $4,739 | $54,741 | $0 | $54,741 |
| 2015 | $4,487 | $48,874 | $0 | $48,874 |
| 2014 | $4,202 | $48,874 | $0 | $48,874 |
Source: Public Records
Map
Nearby Homes
- 780 Walnut St Unit A
- 820 Pearl St
- 620 Pearl St Unit C
- 944 Arapahoe Ave Unit A
- 545 Pearl St
- 1077 Canyon Blvd Unit 304
- 1077 Canyon Blvd Unit 305
- 1077 Canyon Blvd Unit 211
- 934 Spruce St
- 636 Marine St
- 2033 11th St Unit 3, 1
- 613 Pine St
- 377 Pearl St Unit 5
- 505 Pine St
- 604 Mapleton Ave
- 1628 4th St
- 1360 Walnut St Unit 202
- 1360 Walnut St Unit 401
- 643 Mapleton Ave
- 358 Arapahoe Ave Unit C
- 836 Walnut St Unit C
- 836 Walnut St Unit B
- 836 Walnut St Unit A
- 836 Walnut St Unit Walnut Boulder
- 836 Walnut St
- 824 Walnut St Unit 50
- 824 Walnut St Unit 49
- 824 Walnut St Unit 48
- 824 Walnut St Unit 47
- 824 Walnut St Unit 46
- 824 Walnut St Unit 45
- 824 Walnut St Unit 824A Walnut Street
- 824 Walnut St Unit D
- 824 Walnut St Unit A
- 824 Walnut St Unit C
- 780 Walnut St Unit 16
- 780 Walnut St Unit C
- 780 Walnut St Unit 14
- 780 Walnut St Unit 13
- 780 Walnut St Unit B