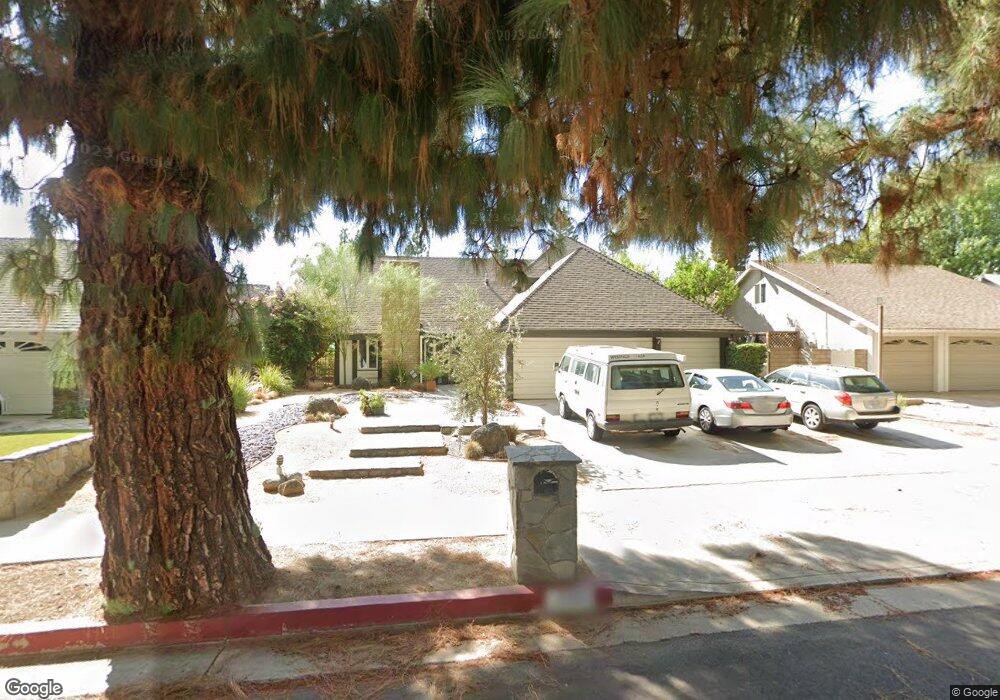
8363 Sale Ave Canoga Park, CA 91304
Estimated Value: $1,175,000 - $1,492,000
4
Beds
2
Baths
2,966
Sq Ft
$430/Sq Ft
Est. Value
About This Home
This home is located at 8363 Sale Ave, Canoga Park, CA 91304 and is currently estimated at $1,276,551, approximately $430 per square foot. 8363 Sale Ave is a home located in Los Angeles County with nearby schools including Nevada Avenue Elementary School, Christopher Columbus Middle School, and Ernest Lawrence Middle School.
Ownership History
Date
Name
Owned For
Owner Type
Purchase Details
Closed on
May 30, 2017
Sold by
Lotte Charles W and Lotte Phuong Luu
Bought by
Lotte Charles W and Lotte Phuong Luu
Current Estimated Value
Purchase Details
Closed on
Oct 2, 1995
Sold by
Rezaifakhr Mohammad and Rezai Niloofar
Bought by
Lotte Charles W and Lotte Phuong L
Home Financials for this Owner
Home Financials are based on the most recent Mortgage that was taken out on this home.
Original Mortgage
$240,000
Interest Rate
7.92%
Purchase Details
Closed on
Feb 17, 1995
Sold by
Before & After Inc
Bought by
Rezaifakhr Mohammad and Rezai Niloofar
Purchase Details
Closed on
Feb 16, 1995
Sold by
Groode Ruth
Bought by
Before & After Inc
Purchase Details
Closed on
Oct 4, 1993
Sold by
Groode Ruth
Bought by
Before & After Inc
Create a Home Valuation Report for This Property
The Home Valuation Report is an in-depth analysis detailing your home's value as well as a comparison with similar homes in the area
Home Values in the Area
Average Home Value in this Area
Purchase History
| Date | Buyer | Sale Price | Title Company |
|---|---|---|---|
| Lotte Charles W | -- | None Available | |
| Lotte Charles W | $303,000 | First American Title Co | |
| Rezaifakhr Mohammad | -- | First American Title Company | |
| Rezaifakhr Mohammad | -- | First American Title Company | |
| Groode Ruth | -- | First American Title Company | |
| Before & After Inc | -- | First American Title Company | |
| Groode Ruth | -- | First American Title Company | |
| Before & After Inc | -- | -- |
Source: Public Records
Mortgage History
| Date | Status | Borrower | Loan Amount |
|---|---|---|---|
| Closed | Lotte Charles W | $240,000 |
Source: Public Records
Tax History Compared to Growth
Tax History
| Year | Tax Paid | Tax Assessment Tax Assessment Total Assessment is a certain percentage of the fair market value that is determined by local assessors to be the total taxable value of land and additions on the property. | Land | Improvement |
|---|---|---|---|---|
| 2025 | $6,346 | $503,340 | $163,457 | $339,883 |
| 2024 | $6,346 | $493,471 | $160,252 | $333,219 |
| 2023 | $6,228 | $483,796 | $157,110 | $326,686 |
| 2022 | $5,949 | $474,311 | $154,030 | $320,281 |
| 2021 | $5,862 | $465,011 | $151,010 | $314,001 |
| 2019 | $5,691 | $451,221 | $146,532 | $304,689 |
| 2018 | $5,557 | $442,374 | $143,659 | $298,715 |
| 2016 | $5,286 | $425,198 | $138,082 | $287,116 |
| 2015 | $5,210 | $418,812 | $136,008 | $282,804 |
| 2014 | $5,233 | $410,609 | $133,344 | $277,265 |
Source: Public Records
Map
Nearby Homes
- 8374 Sausalito Ave
- 8220 Kentland Ave
- 22526 Napa St
- 8398 Shoup Ave
- 8208 Fallbrook Ave
- 8565 N Walnut Way
- 22345 Cantara St
- 8479 Moorcroft Ave
- 22906 Lanark St
- 8401 Farralone Ave
- 7957 Sausalito Ave
- 22180 Chase St
- 8515 Eatough Place
- 8108 Royer Ave
- 22115 Hackney St
- 8389 Sedan Ave
- 22250 Strathern St
- 7845 Sausalito Ave
- 7831 Capistrano Ave
- 22128 Burton St