Estimated Value: $490,000 - $576,000
4
Beds
3
Baths
2,600
Sq Ft
$204/Sq Ft
Est. Value
About This Home
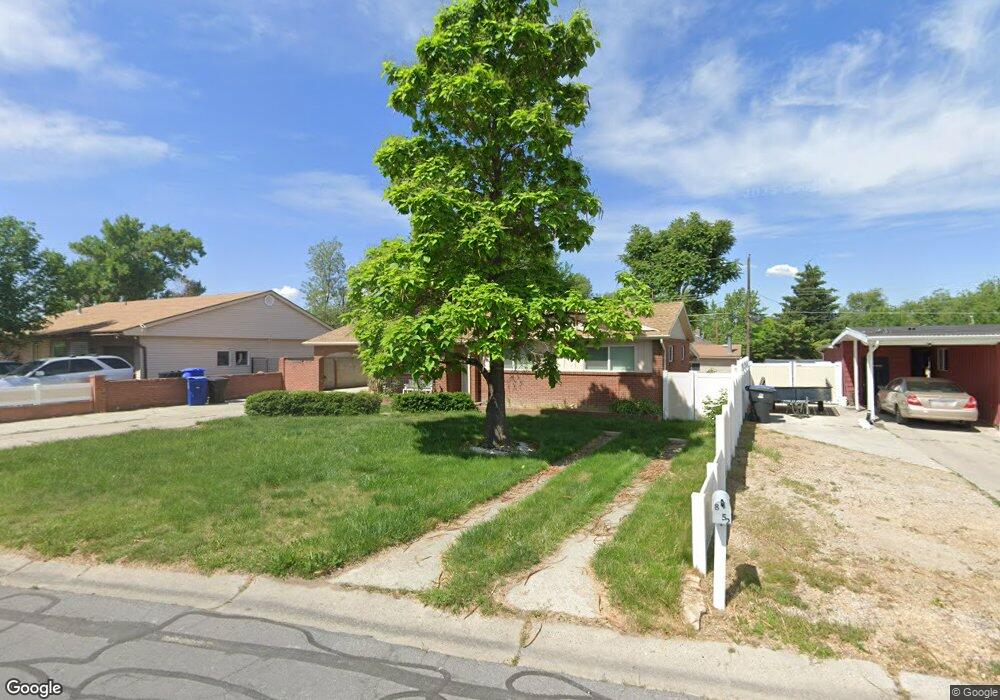
This home is located at 8364 S Bryce Dr, Sandy, UT 84070 and is currently estimated at $530,620, approximately $204 per square foot. 8364 S Bryce Dr is a home located in Salt Lake County with nearby schools including Midvalley Elementary School, Union Middle School, and Hillcrest High School.
Ownership History
Date
Name
Owned For
Owner Type
Purchase Details
Closed on
May 29, 2025
Sold by
Bingham Raymond A and Bingham Nancy R
Bought by
Nelson Nigel and Liddell Hannah
Current Estimated Value
Home Financials for this Owner
Home Financials are based on the most recent Mortgage that was taken out on this home.
Original Mortgage
$484,500
Outstanding Balance
$483,261
Interest Rate
6.83%
Mortgage Type
New Conventional
Estimated Equity
$47,359
Create a Home Valuation Report for This Property
The Home Valuation Report is an in-depth analysis detailing your home's value as well as a comparison with similar homes in the area
Home Values in the Area
Average Home Value in this Area
Purchase History
| Date | Buyer | Sale Price | Title Company |
|---|---|---|---|
| Nelson Nigel | -- | Metro National Title |
Source: Public Records
Mortgage History
| Date | Status | Borrower | Loan Amount |
|---|---|---|---|
| Open | Nelson Nigel | $484,500 |
Source: Public Records
Tax History
| Year | Tax Paid | Tax Assessment Tax Assessment Total Assessment is a certain percentage of the fair market value that is determined by local assessors to be the total taxable value of land and additions on the property. | Land | Improvement |
|---|---|---|---|---|
| 2025 | $2,433 | $456,500 | $127,400 | $329,100 |
| 2024 | $2,433 | $449,500 | $119,700 | $329,800 |
| 2023 | $2,433 | $388,100 | $113,800 | $274,300 |
| 2022 | $2,224 | $400,600 | $111,600 | $289,000 |
| 2021 | $1,999 | $305,900 | $97,000 | $208,900 |
| 2020 | $1,910 | $275,900 | $78,600 | $197,300 |
| 2019 | $1,838 | $258,500 | $78,600 | $179,900 |
| 2018 | $1,571 | $229,100 | $78,600 | $150,500 |
| 2017 | $1,514 | $211,100 | $69,800 | $141,300 |
| 2016 | $1,810 | $205,800 | $69,800 | $136,000 |
| 2015 | $1,898 | $201,000 | $72,600 | $128,400 |
| 2014 | $1,867 | $192,500 | $70,500 | $122,000 |
Source: Public Records
Map
Nearby Homes
- 359 E 8400 S
- 8459 S 300 E
- 227 E St Germain Way
- 8322 S Levine Ln Unit 111
- 194 Pioneer Ave
- 220 E Pioneer Ave
- 144 E Chambord Ct
- 140 E Chambord Ct
- 138 E Chambord Ct
- 8260 S 560 E
- 136 E Chambord Ct
- 132 E Chambord Ct
- 149 E Pioneer Ave
- 8278 S Resaca Dr Unit L1
- 274 E Water Mill Way Unit 230
- 8264 S Resaca Dr Unit K9
- 257 Water Mill Way Unit 211
- 257 E Water Mill Way
- 117 E Calbourne Ln Unit I4
- 116 E Resaca Dr Unit F2
Your Personal Tour Guide
Ask me questions while you tour the home.