Estimated Value: $629,000 - $665,000
5
Beds
3
Baths
2,996
Sq Ft
$216/Sq Ft
Est. Value
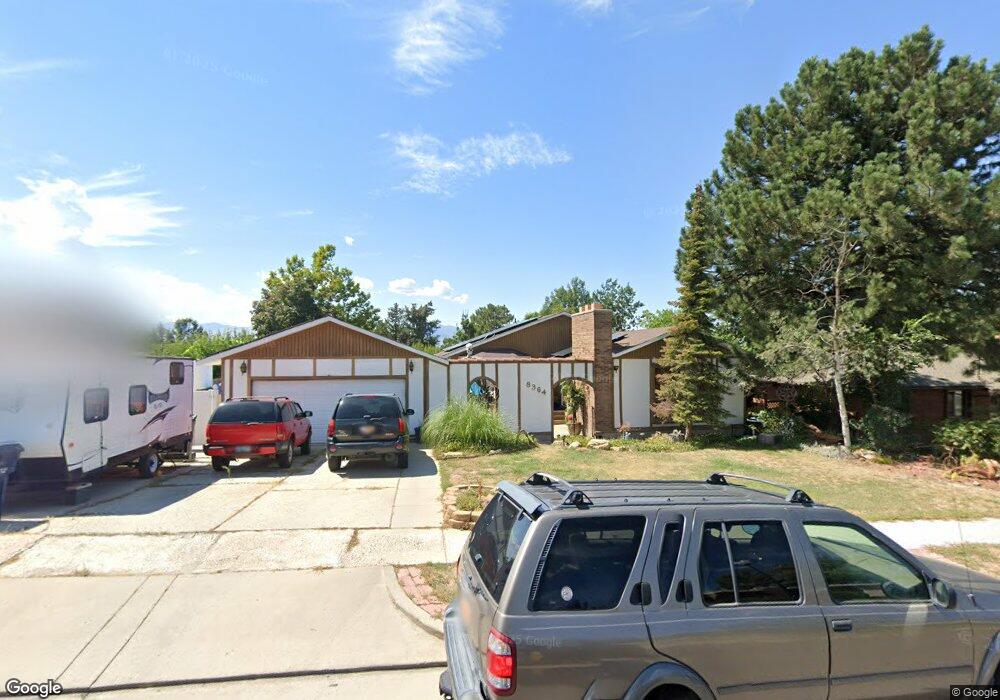
About This Home
This home is located at 8364 S Fayeway Dr, Sandy, UT 84094 and is currently estimated at $647,787, approximately $216 per square foot. 8364 S Fayeway Dr is a home located in Salt Lake County with nearby schools including Peruvian Park Elementary School, Hillcrest High School, and Union Middle School.
Ownership History
Date
Name
Owned For
Owner Type
Purchase Details
Closed on
Dec 26, 2019
Sold by
Benavidez Venice L and Benavidez Sophia S
Bought by
Venice Benavidez and Venice Sophia Sanchez
Current Estimated Value
Home Financials for this Owner
Home Financials are based on the most recent Mortgage that was taken out on this home.
Original Mortgage
$301,180
Outstanding Balance
$268,710
Interest Rate
4.12%
Mortgage Type
FHA
Estimated Equity
$379,077
Purchase Details
Closed on
Mar 16, 2015
Sold by
Li Tien Fu and Lu Hui Ching
Bought by
Benavidez Venice L and Sanchez Sophia S
Home Financials for this Owner
Home Financials are based on the most recent Mortgage that was taken out on this home.
Original Mortgage
$277,874
Interest Rate
3.75%
Mortgage Type
FHA
Purchase Details
Closed on
Oct 22, 2005
Sold by
Walker Richard C and Walker Judith H
Bought by
Li Tien Fu and Lu Hui Ching
Purchase Details
Closed on
Nov 19, 1993
Sold by
Walker Judith H
Bought by
Walker Richard C
Home Financials for this Owner
Home Financials are based on the most recent Mortgage that was taken out on this home.
Original Mortgage
$65,000
Interest Rate
6.39%
Create a Home Valuation Report for This Property
The Home Valuation Report is an in-depth analysis detailing your home's value as well as a comparison with similar homes in the area
Home Values in the Area
Average Home Value in this Area
Purchase History
| Date | Buyer | Sale Price | Title Company |
|---|---|---|---|
| Venice Benavidez | -- | North American Title Llc | |
| Benavidez Venice L | -- | Northwest Title Agcy | |
| Li Tien Fu | -- | Equity Title | |
| Walker Richard C | -- | -- |
Source: Public Records
Mortgage History
| Date | Status | Borrower | Loan Amount |
|---|---|---|---|
| Open | Venice Benavidez | $301,180 | |
| Closed | Benavidez Venice L | $277,874 | |
| Previous Owner | Walker Richard C | $65,000 |
Source: Public Records
Tax History Compared to Growth
Tax History
| Year | Tax Paid | Tax Assessment Tax Assessment Total Assessment is a certain percentage of the fair market value that is determined by local assessors to be the total taxable value of land and additions on the property. | Land | Improvement |
|---|---|---|---|---|
| 2025 | $3,230 | $612,600 | $168,200 | $444,400 |
| 2024 | $3,230 | $612,100 | $161,800 | $450,300 |
| 2023 | $3,178 | $601,700 | $153,800 | $447,900 |
| 2022 | $3,100 | $577,300 | $150,800 | $426,500 |
| 2021 | $2,592 | $411,300 | $117,200 | $294,100 |
| 2020 | $2,460 | $368,600 | $117,200 | $251,400 |
| 2019 | $2,433 | $355,800 | $110,600 | $245,200 |
| 2018 | $2,253 | $345,000 | $110,600 | $234,400 |
| 2017 | $2,053 | $301,000 | $110,600 | $190,400 |
| 2016 | $2,046 | $290,200 | $110,600 | $179,600 |
| 2015 | $1,917 | $252,000 | $133,100 | $118,900 |
| 2014 | $1,759 | $227,200 | $121,900 | $105,300 |
Source: Public Records
Map
Nearby Homes
- 1077 E 8320 S Unit 18
- 8335 S 1050 E
- 1327 Madrid Way
- 8149 S Cottonwood Hills Cir Unit 158149
- 1169 E Cottonwood Hills Dr Unit 56
- 1235 E Cottonwood Hills Dr
- 1263 E Cottonwood Hills Dr
- 8017 S Showcase Ln
- 8643 Vaquero Dr
- 1430 E 8685 S
- 8657 S 910 E
- 1597 Paulista Way
- 842 E 8270 S
- 8492 S Mesa Dr
- 1393 E Galaxie Dr
- 1666 Paulista Way
- 7926 S 965 E
- 8731 Gladiator Way
- 772 E 8270 S
- 8935 Quarry Stone Way
- 8364 Fayeway Dr
- 8382 Fayeway Dr
- 8382 S Fayeway Dr
- 8358 Fayeway Dr
- 8358 S Fayeway Dr
- 8371 Wayside Dr
- 8357 Wayside Dr
- 8383 S Wayside Dr
- 8383 Wayside Dr
- 8394 Fayeway Dr
- 8346 S Fayeway Dr
- 8346 Fayeway Dr
- 8373 Fayeway Dr
- 8373 S Fayeway Dr
- 8385 Fayeway Dr
- 8395 S Wayside Dr
- 8335 Wayside Dr
- 8395 Wayside Dr
- 8335 S Wayside Dr
- 8347 S Fayeway Dr