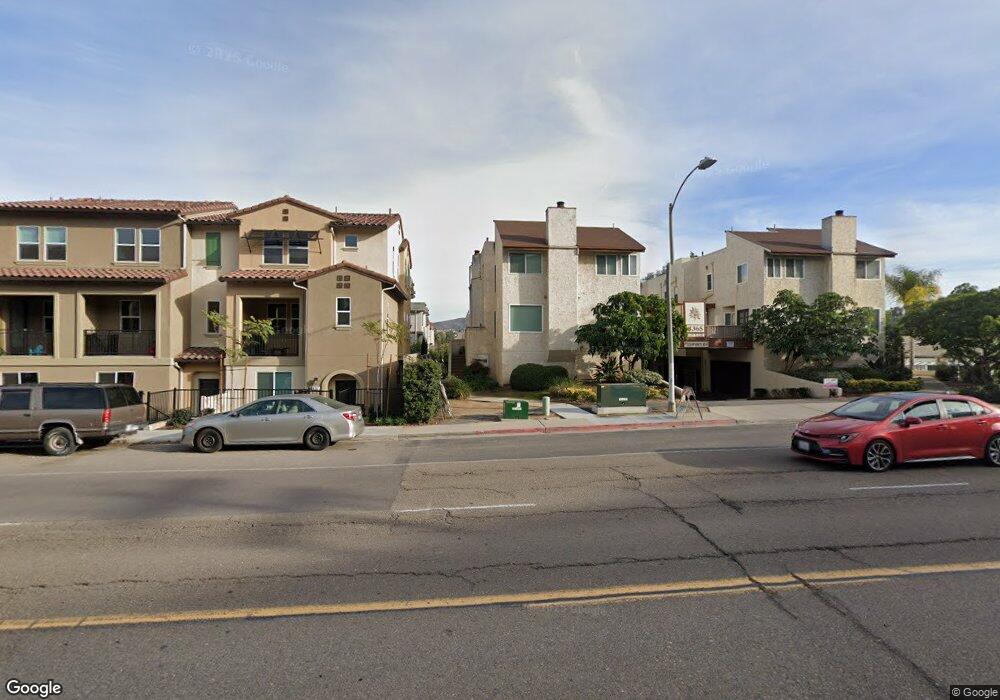
8365 Broadway Unit 10 Lemon Grove, CA 91945
Estimated Value: $430,837 - $513,000
2
Beds
2
Baths
1,184
Sq Ft
$409/Sq Ft
Est. Value
About This Home
This home is located at 8365 Broadway Unit 10, Lemon Grove, CA 91945 and is currently estimated at $484,209, approximately $408 per square foot. 8365 Broadway Unit 10 is a home located in San Diego County with nearby schools including Lemon Grove Academy Middle, Mount Miguel High School, and Sparrow Academy.
Ownership History
Date
Name
Owned For
Owner Type
Purchase Details
Closed on
May 12, 2017
Sold by
Collins Rachelle L and Collins Herman
Bought by
Collins Rachelle L
Current Estimated Value
Purchase Details
Closed on
Apr 20, 1998
Sold by
Va
Bought by
Brown Rachelle L
Home Financials for this Owner
Home Financials are based on the most recent Mortgage that was taken out on this home.
Original Mortgage
$83,460
Outstanding Balance
$15,788
Interest Rate
7.06%
Estimated Equity
$468,421
Purchase Details
Closed on
May 30, 1997
Sold by
Wickware Carl O
Bought by
Guild Mtg Company
Purchase Details
Closed on
May 22, 1997
Sold by
Guild Mtg Company
Bought by
Va
Purchase Details
Closed on
Apr 24, 1992
Purchase Details
Closed on
Mar 16, 1990
Purchase Details
Closed on
Jun 20, 1983
Create a Home Valuation Report for This Property
The Home Valuation Report is an in-depth analysis detailing your home's value as well as a comparison with similar homes in the area
Home Values in the Area
Average Home Value in this Area
Purchase History
| Date | Buyer | Sale Price | Title Company |
|---|---|---|---|
| Collins Rachelle L | -- | First American Title Ins Co | |
| Brown Rachelle L | $86,000 | Southland Title | |
| Guild Mtg Company | $62,684 | First Southwestern Title Co | |
| Va | -- | Northern Counties Title Ins | |
| -- | $98,900 | -- | |
| -- | $89,000 | -- | |
| -- | $81,300 | -- |
Source: Public Records
Mortgage History
| Date | Status | Borrower | Loan Amount |
|---|---|---|---|
| Open | Brown Rachelle L | $83,460 |
Source: Public Records
Tax History Compared to Growth
Tax History
| Year | Tax Paid | Tax Assessment Tax Assessment Total Assessment is a certain percentage of the fair market value that is determined by local assessors to be the total taxable value of land and additions on the property. | Land | Improvement |
|---|---|---|---|---|
| 2025 | $2,311 | $137,287 | $32,293 | $104,994 |
| 2024 | $2,311 | $134,596 | $31,660 | $102,936 |
| 2023 | $2,264 | $131,958 | $31,040 | $100,918 |
| 2022 | $697 | $129,372 | $30,432 | $98,940 |
| 2021 | $697 | $126,836 | $29,836 | $97,000 |
| 2020 | $2,114 | $125,537 | $29,531 | $96,006 |
| 2019 | $2,075 | $123,076 | $28,952 | $94,124 |
| 2018 | $2,025 | $120,664 | $28,385 | $92,279 |
| 2017 | $1,989 | $118,299 | $27,829 | $90,470 |
| 2016 | $1,910 | $115,981 | $27,284 | $88,697 |
| 2015 | $1,900 | $114,240 | $26,875 | $87,365 |
| 2014 | $1,834 | $112,003 | $26,349 | $85,654 |
Source: Public Records
Map
Nearby Homes
- 3443 Trophy Dr
- 3422 Trophy Dr
- 8621 Golf Dr
- 3708 Fairway Dr
- 7520 High St
- 8271 Golden Ave
- 8186 Lemon Grove Way Unit E
- 8166 Lemon Grove Way Unit B
- 3834 Polaris Dr
- 8192 Golden Ave
- 8190 Golden Ave
- 8188 Golden Ave
- 8186 Golden Ave
- 8180 Golden Ave
- 8184 Golden Ave
- 8182 Golden Ave
- 8176 Golden Ave
- 8174 Golden Ave
- 8178 Golden Ave
- 8172 Golden Ave
- 8365 Broadway Unit 15
- 8365 Broadway Unit 13
- 8365 Broadway Unit 11
- 8365 Broadway Unit 9
- 8365 Broadway Unit 7
- 8365 Broadway Unit 5
- 8365 Broadway Unit 3
- 8365 Broadway Unit 1
- 8365 Broadway Unit 12
- 8365 Broadway Unit 14
- 8365 Broadway Unit 16
- 8365 Broadway Unit 18
- 8365 Broadway Unit 20
- 8365 Broadway Unit 22
- 8365 Broadway Unit 24
- 8365 Broadway Unit 26
- 8365 Broadway Unit 28
- 8365 Broadway Unit 27
- 8365 Broadway Unit 25
- 8365 Broadway Unit 23