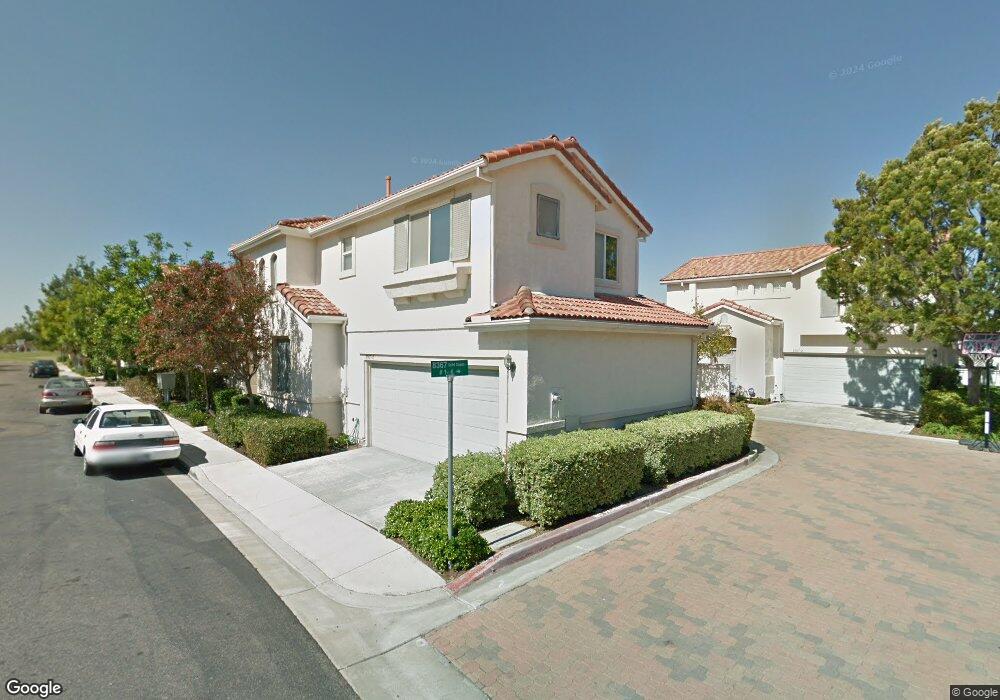
8367 Gold Coast Dr Unit 1 San Diego, CA 92126
Mira Mesa NeighborhoodEstimated Value: $900,277 - $945,000
3
Beds
3
Baths
1,343
Sq Ft
$688/Sq Ft
Est. Value
About This Home
This home is located at 8367 Gold Coast Dr Unit 1, San Diego, CA 92126 and is currently estimated at $924,319, approximately $688 per square foot. 8367 Gold Coast Dr Unit 1 is a home located in San Diego County with nearby schools including Mason Elementary School, Wangenheim Middle School, and Mira Mesa High School.
Ownership History
Date
Name
Owned For
Owner Type
Purchase Details
Closed on
Jul 25, 2001
Sold by
Clay William Joseph and Clay Rachael Denise
Bought by
Pugeda Alona Leah A
Current Estimated Value
Home Financials for this Owner
Home Financials are based on the most recent Mortgage that was taken out on this home.
Original Mortgage
$214,400
Outstanding Balance
$83,044
Interest Rate
7.21%
Mortgage Type
Purchase Money Mortgage
Estimated Equity
$841,275
Purchase Details
Closed on
Oct 21, 1997
Sold by
Pardee Construction Company
Bought by
Clay William Joseph and Grillo Rachael Denise
Home Financials for this Owner
Home Financials are based on the most recent Mortgage that was taken out on this home.
Original Mortgage
$148,000
Interest Rate
7.26%
Mortgage Type
FHA
Create a Home Valuation Report for This Property
The Home Valuation Report is an in-depth analysis detailing your home's value as well as a comparison with similar homes in the area
Home Values in the Area
Average Home Value in this Area
Purchase History
| Date | Buyer | Sale Price | Title Company |
|---|---|---|---|
| Pugeda Alona Leah A | $268,000 | Old Republic Title Company | |
| Clay William Joseph | $155,000 | Chicago Title Co |
Source: Public Records
Mortgage History
| Date | Status | Borrower | Loan Amount |
|---|---|---|---|
| Open | Pugeda Alona Leah A | $214,400 | |
| Previous Owner | Clay William Joseph | $148,000 | |
| Closed | Pugeda Alona Leah A | $40,200 |
Source: Public Records
Tax History Compared to Growth
Tax History
| Year | Tax Paid | Tax Assessment Tax Assessment Total Assessment is a certain percentage of the fair market value that is determined by local assessors to be the total taxable value of land and additions on the property. | Land | Improvement |
|---|---|---|---|---|
| 2025 | $4,993 | $417,742 | $127,935 | $289,807 |
| 2024 | $4,993 | $409,552 | $125,427 | $284,125 |
| 2023 | $4,881 | $373,061 | $120,557 | $252,504 |
| 2022 | $4,499 | $373,061 | $120,557 | $252,504 |
| 2021 | $4,466 | $365,747 | $118,194 | $247,553 |
| 2020 | $4,411 | $361,998 | $116,983 | $245,015 |
| 2019 | $4,330 | $354,901 | $114,690 | $240,211 |
| 2018 | $4,131 | $347,943 | $112,442 | $235,501 |
| 2017 | $3,948 | $341,122 | $110,238 | $230,884 |
| 2016 | $3,883 | $334,434 | $108,077 | $226,357 |
| 2015 | $3,825 | $329,411 | $106,454 | $222,957 |
| 2014 | $3,764 | $322,959 | $104,369 | $218,590 |
Source: Public Records
Map
Nearby Homes
- 10265 Eagle Rock Ave
- 10174 Camino Ruiz Unit 46
- 10166 Camino Ruiz Unit 32
- 8516 Flanders Dr
- 14331 Montano Way
- 14341 Montano Way
- 14659 Dunleer Way
- 14633 Dunleer Way
- 14641 Dunleer Way
- 8014 Hemphill Dr
- 7971 Jade Coast Rd
- 7944 Calico St
- 10573 Caminito Flores
- 8670 New Salem St Unit 106
- 7857 Embry Point
- 8650 New Salem St Unit 27
- 8644 New Salem St Unit 6
- 8654 New Salem St Unit 44
- 10422 Londonderry Ave
- 8378 New Salem St Unit 24
- 8371 Gold Coast Dr
- 8367 Gold Coast Dr
- 8363 Gold Coast Dr Unit 7
- 8371 Gold Coast Dr Unit 6
- 8371 Gold Coast Dr Unit 5
- 8371 Gold Coast Dr Unit 4
- 8371 Gold Coast Dr Unit 3
- 8371 Gold Coast Dr Unit 2
- 8371 Gold Coast Dr Unit 1
- 8363 Gold Coast Dr Unit 1
- 8363 Gold Coast Dr Unit 2
- 8363 Gold Coast Dr Unit 3
- 8363 Gold Coast Dr Unit 4
- 8363 Gold Coast Dr Unit 5
- 8363 Gold Coast Dr Unit 6
- 8363 Gold Coast Dr Unit 8
- 8367 Gold Coast Dr Unit 3
- 8367 Gold Coast Dr Unit 4
- 8375 Gold Coast Dr Unit 1
- 8375 Gold Coast Dr Unit 2