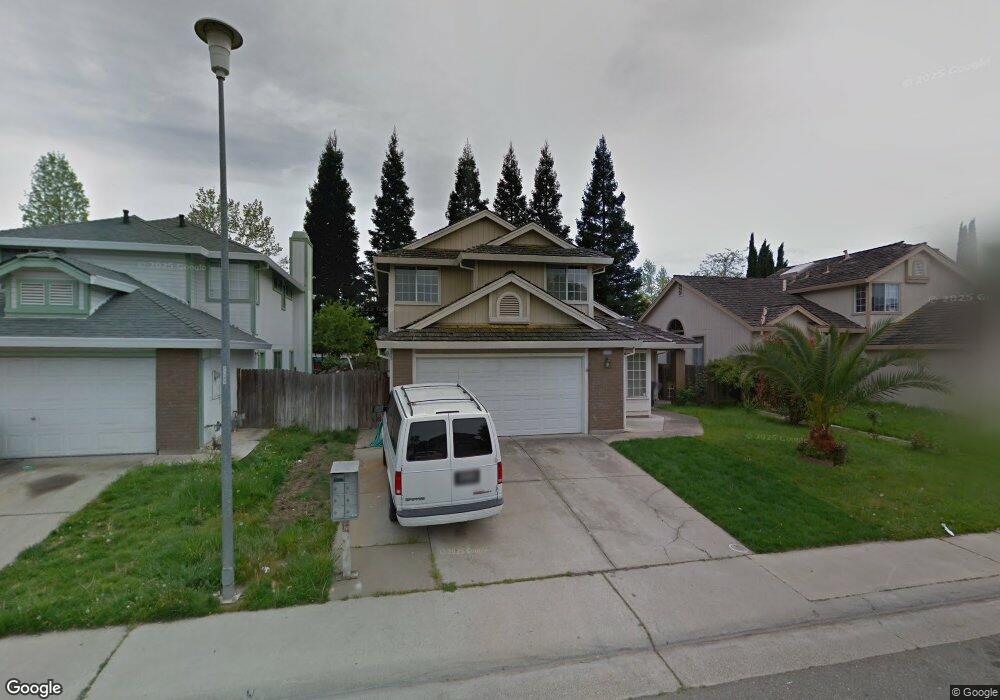
8368 Trimmer Way Sacramento, CA 95828
Estimated Value: $457,000 - $567,000
4
Beds
3
Baths
2,029
Sq Ft
$258/Sq Ft
Est. Value
About This Home
This home is located at 8368 Trimmer Way, Sacramento, CA 95828 and is currently estimated at $524,296, approximately $258 per square foot. 8368 Trimmer Way is a home located in Sacramento County with nearby schools including Isabelle Jackson Elementary School, James Rutter Middle School, and Florin High School.
Ownership History
Date
Name
Owned For
Owner Type
Purchase Details
Closed on
Feb 22, 2007
Sold by
Cornejo Feliciano
Bought by
Cornejo Feliciano and Cornejo Lorena M
Current Estimated Value
Purchase Details
Closed on
Dec 20, 2004
Sold by
Ng Tony
Bought by
Cornejo Feliciano
Home Financials for this Owner
Home Financials are based on the most recent Mortgage that was taken out on this home.
Original Mortgage
$190,000
Outstanding Balance
$95,342
Interest Rate
5.76%
Mortgage Type
Purchase Money Mortgage
Estimated Equity
$428,954
Purchase Details
Closed on
Nov 20, 1998
Sold by
Us Bank National Assn
Bought by
Ng Tony
Purchase Details
Closed on
Mar 11, 1998
Sold by
Bough Valdemar and Bough Glenda
Bought by
United States National Bank Of Oregon
Create a Home Valuation Report for This Property
The Home Valuation Report is an in-depth analysis detailing your home's value as well as a comparison with similar homes in the area
Home Values in the Area
Average Home Value in this Area
Purchase History
| Date | Buyer | Sale Price | Title Company |
|---|---|---|---|
| Cornejo Feliciano | -- | None Available | |
| Cornejo Feliciano | $361,000 | Placer Title Company | |
| Ng Tony | $136,000 | Stewart Title | |
| United States National Bank Of Oregon | $144,000 | First American Title Ins Co |
Source: Public Records
Mortgage History
| Date | Status | Borrower | Loan Amount |
|---|---|---|---|
| Open | Cornejo Feliciano | $190,000 |
Source: Public Records
Tax History Compared to Growth
Tax History
| Year | Tax Paid | Tax Assessment Tax Assessment Total Assessment is a certain percentage of the fair market value that is determined by local assessors to be the total taxable value of land and additions on the property. | Land | Improvement |
|---|---|---|---|---|
| 2025 | $5,406 | $503,043 | $104,533 | $398,510 |
| 2024 | $5,406 | $493,181 | $102,484 | $390,697 |
| 2023 | $5,270 | $483,512 | $100,475 | $383,037 |
| 2022 | $5,179 | $474,032 | $98,505 | $375,527 |
| 2021 | $4,381 | $395,074 | $82,095 | $312,979 |
| 2020 | $3,885 | $349,624 | $72,651 | $276,973 |
| 2019 | $3,645 | $326,753 | $67,899 | $258,854 |
| 2018 | $3,483 | $314,187 | $65,288 | $248,899 |
| 2017 | $3,272 | $293,633 | $61,017 | $232,616 |
| 2016 | $2,948 | $271,884 | $56,498 | $215,386 |
| 2015 | $2,685 | $247,168 | $51,362 | $195,806 |
| 2014 | $2,549 | $233,178 | $48,455 | $184,723 |
Source: Public Records
Map
Nearby Homes
- 8336 Cutler Way
- 8437 Yermo Way
- 8317 Honeycomb Way
- 8329 Spengler Dr
- 8233 Short Rd
- 8251 Apple Cove Ct
- 8346 Floxtree Ct
- 8186 Gustine Way
- 8216 Exbourne Cir
- 8510 Cavendish Way
- 8159 Morgan Hill Way
- 7905 Springarden Way
- 8077 Goran Ct
- 8336 Summer Sunset Dr
- 8266 Summer Sunset Dr
- 8282 Union Creek Way
- 8578 Hydrangea Ct
- 8548 Whitby Ct
- 7901 Stevenson Ave
- 7855 Cottonwood Ln Unit 118
- 8364 Trimmer Way
- 8372 Trimmer Way
- 8360 Trimmer Way
- 8376 Trimmer Way
- 8367 Trimmer Way
- 8356 Trimmer Way
- 8371 Trimmer Way
- 8363 Trimmer Way
- 8380 Trimmer Way
- 8359 Trimmer Way
- 8375 Trimmer Way
- 8313 Alpinmead Cir
- 8317 Alpinmead Cir
- 8309 Alpinmead Cir
- 8352 Trimmer Way
- 8355 Trimmer Way
- 8321 Alpinmead Cir
- 8305 Alpinmead Cir
- 8377 Trimmer Way
- 8325 Alpinmead Cir