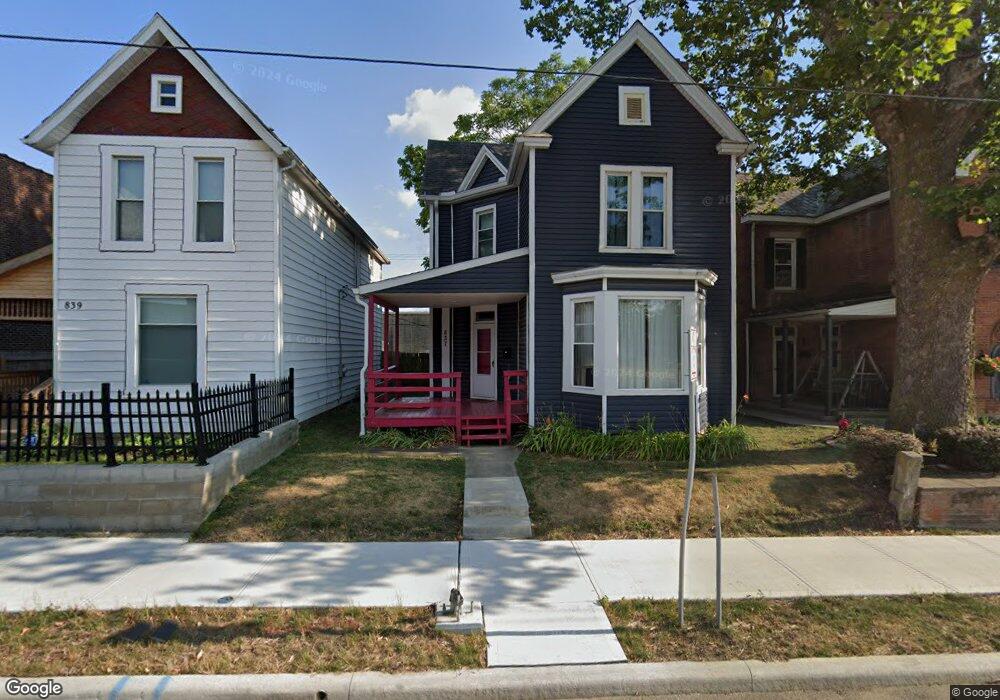
837 E 2nd Ave Columbus, OH 43201
Milo-Grogan NeighborhoodEstimated Value: $105,000 - $205,000
3
Beds
1
Bath
1,611
Sq Ft
$96/Sq Ft
Est. Value
About This Home
This home is located at 837 E 2nd Ave, Columbus, OH 43201 and is currently estimated at $154,995, approximately $96 per square foot. 837 E 2nd Ave is a home located in Franklin County with nearby schools including Windsor Stem Acadmey, Linden-Mckinley Stem School On Arcadia, and Columbus Performance Academy.
Ownership History
Date
Name
Owned For
Owner Type
Purchase Details
Closed on
Feb 23, 2007
Sold by
Ransom Paul A
Bought by
Starr Aaron W and Starr Emily J
Current Estimated Value
Home Financials for this Owner
Home Financials are based on the most recent Mortgage that was taken out on this home.
Original Mortgage
$48,400
Interest Rate
6.02%
Mortgage Type
Purchase Money Mortgage
Purchase Details
Closed on
Apr 23, 2002
Sold by
Hud
Bought by
Ransom Paul A
Home Financials for this Owner
Home Financials are based on the most recent Mortgage that was taken out on this home.
Original Mortgage
$28,000
Interest Rate
8%
Mortgage Type
Purchase Money Mortgage
Purchase Details
Closed on
Jul 23, 2001
Sold by
Jeffries Rosaline Y
Bought by
Hud
Purchase Details
Closed on
Oct 30, 1997
Sold by
Singer Steven J and Singer Steven
Bought by
Jeffries Rosaline Y
Home Financials for this Owner
Home Financials are based on the most recent Mortgage that was taken out on this home.
Original Mortgage
$48,552
Interest Rate
7.42%
Mortgage Type
FHA
Create a Home Valuation Report for This Property
The Home Valuation Report is an in-depth analysis detailing your home's value as well as a comparison with similar homes in the area
Home Values in the Area
Average Home Value in this Area
Purchase History
| Date | Buyer | Sale Price | Title Company |
|---|---|---|---|
| Starr Aaron W | $51,000 | Hostetler Title | |
| Ransom Paul A | $35,100 | Contract Processing & Title | |
| Hud | $24,600 | -- | |
| Jeffries Rosaline Y | $49,000 | Preferred Title Agency Inc |
Source: Public Records
Mortgage History
| Date | Status | Borrower | Loan Amount |
|---|---|---|---|
| Closed | Starr Aaron W | $48,400 | |
| Previous Owner | Ransom Paul A | $28,000 | |
| Previous Owner | Jeffries Rosaline Y | $48,552 |
Source: Public Records
Tax History
| Year | Tax Paid | Tax Assessment Tax Assessment Total Assessment is a certain percentage of the fair market value that is determined by local assessors to be the total taxable value of land and additions on the property. | Land | Improvement |
|---|---|---|---|---|
| 2025 | $2,025 | $45,120 | $5,110 | $40,010 |
| 2024 | $2,025 | $45,120 | $5,110 | $40,010 |
| 2023 | $1,999 | $45,120 | $5,110 | $40,010 |
| 2022 | $1,157 | $22,300 | $2,100 | $20,200 |
| 2021 | $1,159 | $22,300 | $2,100 | $20,200 |
| 2020 | $1,160 | $22,300 | $2,100 | $20,200 |
| 2019 | $1,142 | $18,830 | $1,820 | $17,010 |
| 2018 | $570 | $18,830 | $1,820 | $17,010 |
| 2017 | $1,142 | $18,830 | $1,820 | $17,010 |
| 2016 | $979 | $14,780 | $2,140 | $12,640 |
| 2015 | $444 | $14,780 | $2,140 | $12,640 |
| 2014 | $891 | $14,780 | $2,140 | $12,640 |
| 2013 | $488 | $16,415 | $2,380 | $14,035 |
Source: Public Records
Map
Nearby Homes
- 841 Saint Clair Ave
- 765 E 2nd Ave
- 773-775 E 3rd Ave
- 997-999 Gibbard Ave
- 663 E 2nd Ave
- 780-782 Gibbard Ave
- 796 E 4th Ave
- 606 Reynolds Ave
- 1000 N 9th St
- 865 Old Leonard Ave
- 489 Saint Clair Ave
- 915 Old Leonard Ave
- 276 E 4th Ave
- 1141 Peters Ave
- 437-439 Saint Clair Ave
- 472 Reynolds Ave Unit 474
- 423 Saint Clair Ave
- 774 Buckingham St
- 927 Camden Ave
- 923 Camden Ave
- 839 E 2nd Ave
- 835 E 2nd Ave
- 843 E 2nd Ave Unit 845
- 829 E 2nd Ave
- 823 E 2nd Ave
- 847 E 2nd Ave Unit 849
- 819 E 2nd Ave
- 857 E 2nd Ave
- 815 E 2nd Ave
- 840 Reynolds Ave
- 820 Reynolds Ave
- 804 Reynolds Ave
- 850 Reynolds Ave
- 809-811 E 2nd Ave
- 809 E 2nd Ave Unit 811
- 809 E 2nd Ave Unit 11
- 805 E 2nd Ave Unit 807
- 800 Reynolds Ave
- 799 E 2nd Ave
- 806 E 2nd Ave
Your Personal Tour Guide
Ask me questions while you tour the home.