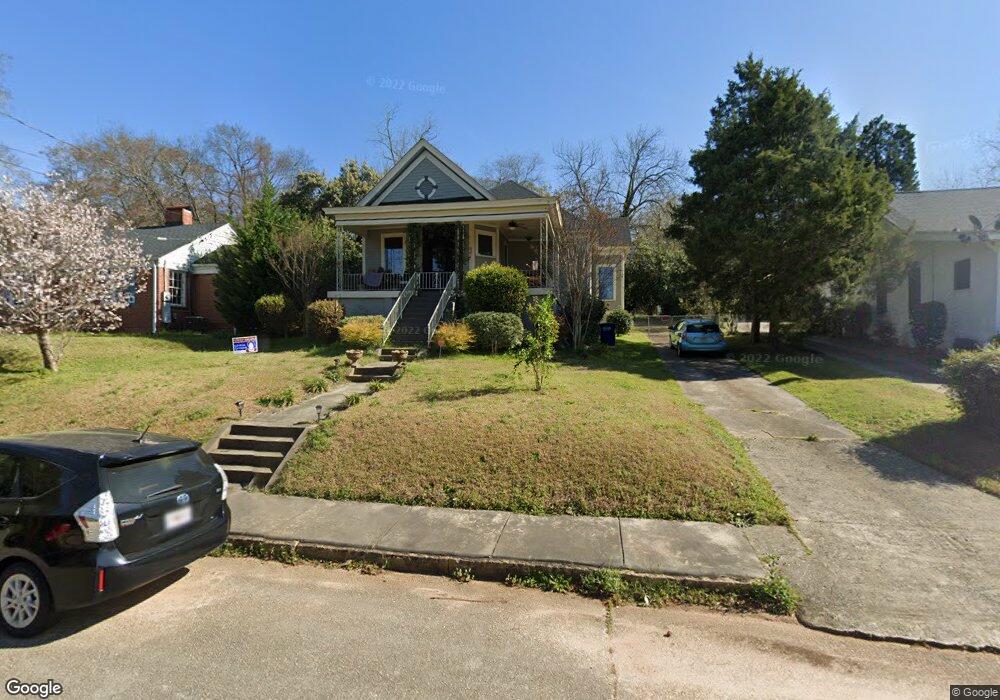
837 Laurel Ave Unit 304-B9 Macon, GA 31211
North Highlands Historic District NeighborhoodEstimated Value: $119,000 - $142,000
2
Beds
3
Baths
1,491
Sq Ft
$89/Sq Ft
Est. Value
About This Home
This home is located at 837 Laurel Ave Unit 304-B9, Macon, GA 31211 and is currently estimated at $133,257, approximately $89 per square foot. 837 Laurel Ave Unit 304-B9 is a home located in Bibb County with nearby schools including Burdell Elementary School, Appling Middle School, and Northeast High School.
Ownership History
Date
Name
Owned For
Owner Type
Purchase Details
Closed on
Jul 26, 2019
Sold by
Asset Secure Inc
Bought by
Vangunten Autumn
Current Estimated Value
Home Financials for this Owner
Home Financials are based on the most recent Mortgage that was taken out on this home.
Original Mortgage
$121,250
Outstanding Balance
$105,998
Interest Rate
3.82%
Mortgage Type
New Conventional
Estimated Equity
$27,259
Purchase Details
Closed on
Oct 4, 2018
Sold by
State Bank And Trust Company
Bought by
Asset Secure Inc
Purchase Details
Closed on
Jul 25, 2008
Sold by
Grinstead Charles H and Patterson Dorothy K
Bought by
Ethrdige Charlotte
Home Financials for this Owner
Home Financials are based on the most recent Mortgage that was taken out on this home.
Original Mortgage
$84,570
Interest Rate
6.43%
Mortgage Type
Purchase Money Mortgage
Create a Home Valuation Report for This Property
The Home Valuation Report is an in-depth analysis detailing your home's value as well as a comparison with similar homes in the area
Home Values in the Area
Average Home Value in this Area
Purchase History
| Date | Buyer | Sale Price | Title Company |
|---|---|---|---|
| Vangunten Autumn | $125,000 | None Available | |
| Asset Secure Inc | $65,000 | None Available | |
| Ethrdige Charlotte | $54,500 | None Available |
Source: Public Records
Mortgage History
| Date | Status | Borrower | Loan Amount |
|---|---|---|---|
| Open | Vangunten Autumn | $121,250 | |
| Previous Owner | Ethrdige Charlotte | $84,570 |
Source: Public Records
Tax History Compared to Growth
Tax History
| Year | Tax Paid | Tax Assessment Tax Assessment Total Assessment is a certain percentage of the fair market value that is determined by local assessors to be the total taxable value of land and additions on the property. | Land | Improvement |
|---|---|---|---|---|
| 2025 | $765 | $38,143 | $4,960 | $33,183 |
| 2024 | $753 | $36,642 | $4,960 | $31,682 |
| 2023 | $258 | $35,141 | $4,960 | $30,181 |
| 2022 | $859 | $31,818 | $4,184 | $27,634 |
| 2021 | $767 | $27,189 | $3,613 | $23,576 |
| 2020 | $725 | $25,681 | $3,233 | $22,448 |
| 2019 | $778 | $19,883 | $3,233 | $16,650 |
| 2018 | $1,364 | $19,751 | $3,233 | $16,518 |
| 2017 | $584 | $15,587 | $3,688 | $11,899 |
| 2016 | $539 | $15,586 | $3,688 | $11,899 |
| 2015 | $732 | $14,945 | $4,148 | $10,797 |
| 2014 | $573 | $16,251 | $4,148 | $12,102 |
Source: Public Records
Map
Nearby Homes
- 916 Summit Ave
- 845 N Garden Terrace
- 846 N Garden Terrace
- 988 North Ave
- 1006 Clay Ave Unit 1008,1020,1022
- 1020 Clay Ave
- 939 Boulevard
- 940 Curry Dr
- 833 Parkview Ct
- 378 Cowan St
- 390 Cowan St
- 842 Little Short St
- 990 Center St
- 970 Center St
- 363 AND 361 Woolfolk St
- 363 Woolfolk St Unit 361 Woolfolk Street
- 1158 Jackson Springs Rd
- 1260 Jackson Springs Rd
- 658 Pringle St
- 1059 Fort Hill St
- 837 Laurel Ave
- 841 Laurel Ave
- 829 Laurel Ave
- 845 Laurel Ave
- 825 Laurel Ave
- 870 North Ave
- 860 North Ave
- 860 North Ave Unit 8
- 880 North Ave
- 850 North Ave
- 849 Laurel Ave
- 821 Laurel Ave
- 902 Summit Ave
- 836 Laurel Ave
- 840 North Ave
- 840 Laurel Ave
- 830 Laurel Ave
- 906 Summit Ave
- 824 Laurel Ave
- 857 Laurel Ave