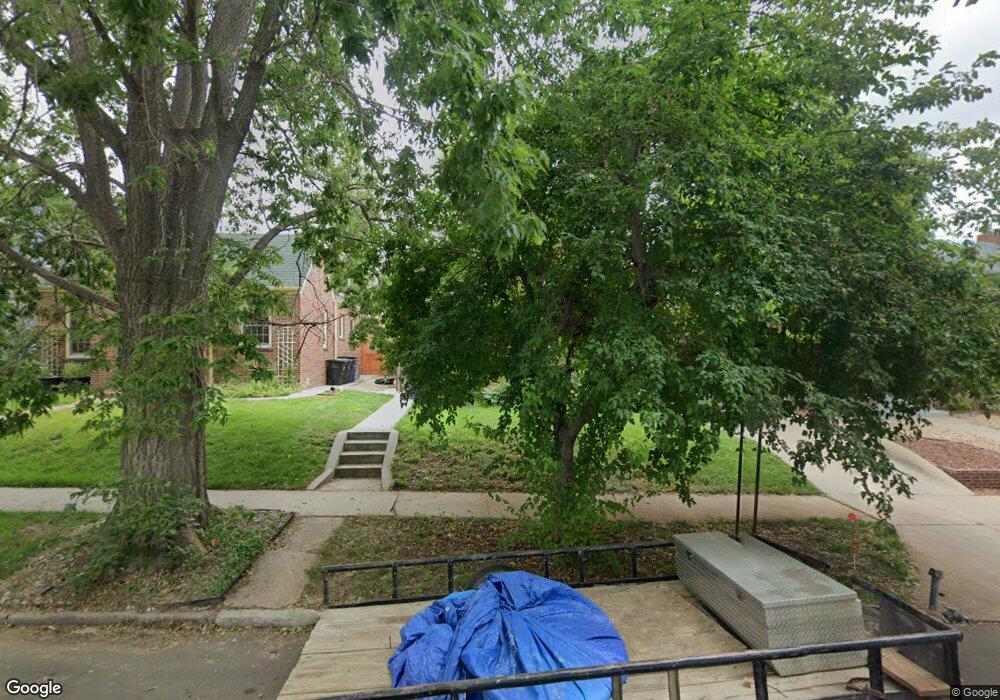
837 Monroe St Denver, CO 80206
Congress Park NeighborhoodEstimated Value: $673,643 - $809,000
2
Beds
2
Baths
1,250
Sq Ft
$601/Sq Ft
Est. Value
About This Home
This home is located at 837 Monroe St, Denver, CO 80206 and is currently estimated at $751,661, approximately $601 per square foot. 837 Monroe St is a home located in Denver County with nearby schools including Teller Elementary School, Morey Middle School, and East High School.
Ownership History
Date
Name
Owned For
Owner Type
Purchase Details
Closed on
Aug 26, 2021
Sold by
Accept Holdings And Relocation Llc
Bought by
Pollack Benjamin
Current Estimated Value
Home Financials for this Owner
Home Financials are based on the most recent Mortgage that was taken out on this home.
Original Mortgage
$586,800
Outstanding Balance
$528,410
Interest Rate
2.7%
Mortgage Type
New Conventional
Estimated Equity
$223,252
Purchase Details
Closed on
Jul 28, 2021
Sold by
Sigg Julie K
Bought by
Accept Holdings And Relocation Llc
Home Financials for this Owner
Home Financials are based on the most recent Mortgage that was taken out on this home.
Original Mortgage
$586,800
Outstanding Balance
$528,410
Interest Rate
2.7%
Mortgage Type
New Conventional
Estimated Equity
$223,252
Purchase Details
Closed on
Oct 30, 2008
Sold by
Crain William Victor
Bought by
Sigg Julie K
Home Financials for this Owner
Home Financials are based on the most recent Mortgage that was taken out on this home.
Original Mortgage
$327,750
Interest Rate
6.08%
Mortgage Type
FHA
Create a Home Valuation Report for This Property
The Home Valuation Report is an in-depth analysis detailing your home's value as well as a comparison with similar homes in the area
Home Values in the Area
Average Home Value in this Area
Purchase History
| Date | Buyer | Sale Price | Title Company |
|---|---|---|---|
| Pollack Benjamin | $652,000 | None Available | |
| Accept Holdings And Relocation Llc | $652,000 | Modern Closing Llc | |
| Sigg Julie K | $345,000 | None Available |
Source: Public Records
Mortgage History
| Date | Status | Borrower | Loan Amount |
|---|---|---|---|
| Open | Pollack Benjamin | $586,800 | |
| Previous Owner | Sigg Julie K | $327,750 |
Source: Public Records
Tax History
| Year | Tax Paid | Tax Assessment Tax Assessment Total Assessment is a certain percentage of the fair market value that is determined by local assessors to be the total taxable value of land and additions on the property. | Land | Improvement |
|---|---|---|---|---|
| 2025 | $4,141 | $56,190 | $38,090 | $38,090 |
| 2024 | $4,141 | $52,280 | $36,860 | $15,420 |
| 2023 | $4,051 | $52,280 | $36,860 | $15,420 |
| 2022 | $3,406 | $42,830 | $24,030 | $18,800 |
| 2021 | $3,288 | $44,060 | $24,720 | $19,340 |
| 2020 | $3,012 | $40,600 | $13,910 | $26,690 |
| 2019 | $2,928 | $40,600 | $13,910 | $26,690 |
| 2018 | $2,709 | $35,020 | $12,450 | $22,570 |
| 2017 | $2,701 | $35,020 | $12,450 | $22,570 |
| 2016 | $2,649 | $32,490 | $12,043 | $20,447 |
| 2015 | $2,538 | $32,490 | $12,043 | $20,447 |
| 2014 | $2,482 | $29,880 | $17,687 | $12,193 |
Source: Public Records
Map
Nearby Homes
- 864 Garfield St
- 909 Madison St
- 801 Harrison St
- 680 Madison St
- 800 Steele St
- 3720 E 7th Avenue Pkwy
- 945 Adams St
- 756 Steele St
- 1013 Adams St
- 1060 Cook St
- 1070 Cook St Unit 1072
- 566 Cook St Unit 570
- 581 Garfield St
- 628 Harrison St
- 1035 Colorado Blvd Unit 406
- 1109 Harrison St
- 542 Adams St
- 576 Steele St
- 1106 Steele St
- 639 Albion St
Your Personal Tour Guide
Ask me questions while you tour the home.