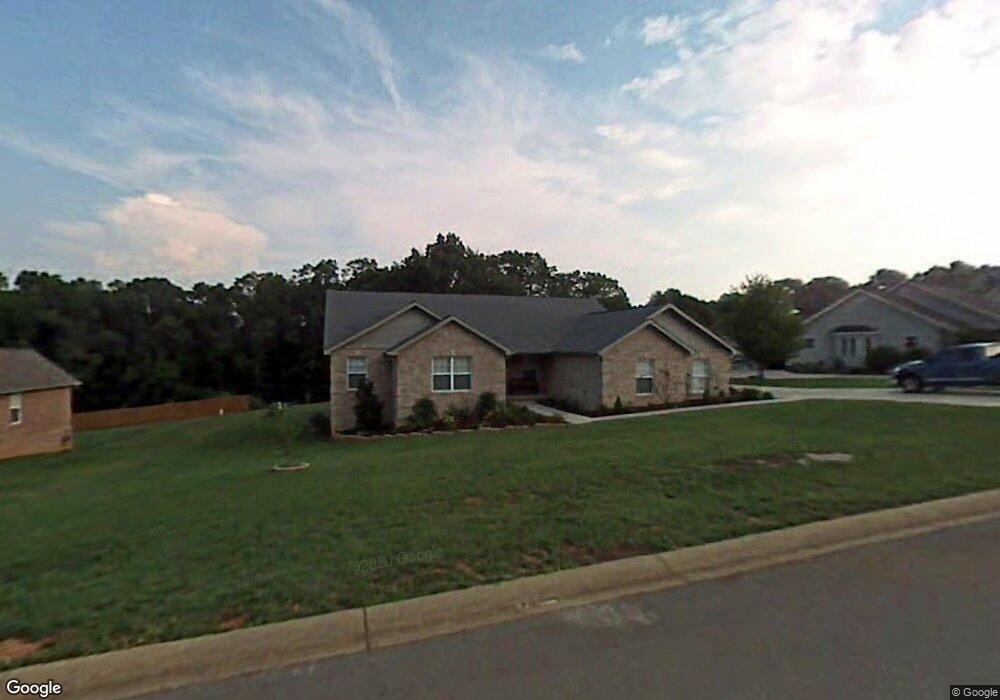
837 Reagan View Ln Seymour, TN 37865
Estimated Value: $432,247 - $461,000
--
Bed
2
Baths
1,854
Sq Ft
$241/Sq Ft
Est. Value
About This Home
This home is located at 837 Reagan View Ln, Seymour, TN 37865 and is currently estimated at $446,624, approximately $240 per square foot. 837 Reagan View Ln is a home located in Sevier County with nearby schools including Northview Elementary School, Catons Chapel Elementary School, and Jones Cove Elementary School.
Ownership History
Date
Name
Owned For
Owner Type
Purchase Details
Closed on
Jun 16, 2006
Sold by
Mann Richard L
Bought by
Wilkinson Michael L
Current Estimated Value
Home Financials for this Owner
Home Financials are based on the most recent Mortgage that was taken out on this home.
Original Mortgage
$181,800
Outstanding Balance
$106,884
Interest Rate
6.57%
Estimated Equity
$339,740
Purchase Details
Closed on
Nov 12, 2004
Sold by
Brewster Brenda E
Bought by
Mann Richard L
Home Financials for this Owner
Home Financials are based on the most recent Mortgage that was taken out on this home.
Original Mortgage
$184,900
Interest Rate
6.43%
Purchase Details
Closed on
Mar 3, 2004
Sold by
Brewster Ernest L
Bought by
Brewster Brenda E
Purchase Details
Closed on
Jul 14, 2003
Sold by
Brown Benny R
Bought by
Brewster Brenda E
Home Financials for this Owner
Home Financials are based on the most recent Mortgage that was taken out on this home.
Original Mortgage
$144,000
Interest Rate
5.16%
Create a Home Valuation Report for This Property
The Home Valuation Report is an in-depth analysis detailing your home's value as well as a comparison with similar homes in the area
Home Values in the Area
Average Home Value in this Area
Purchase History
| Date | Buyer | Sale Price | Title Company |
|---|---|---|---|
| Wilkinson Michael L | $202,000 | -- | |
| Mann Richard L | $184,900 | -- | |
| Brewster Brenda E | -- | -- | |
| Brewster Brenda E | $24,000 | -- |
Source: Public Records
Mortgage History
| Date | Status | Borrower | Loan Amount |
|---|---|---|---|
| Open | Brewster Brenda E | $181,800 | |
| Previous Owner | Brewster Brenda E | $184,900 | |
| Previous Owner | Brewster Brenda E | $144,000 |
Source: Public Records
Tax History Compared to Growth
Tax History
| Year | Tax Paid | Tax Assessment Tax Assessment Total Assessment is a certain percentage of the fair market value that is determined by local assessors to be the total taxable value of land and additions on the property. | Land | Improvement |
|---|---|---|---|---|
| 2025 | $966 | $65,275 | $10,000 | $55,275 |
| 2024 | $966 | $65,275 | $10,000 | $55,275 |
| 2023 | $966 | $65,275 | $0 | $0 |
| 2022 | $966 | $65,275 | $10,000 | $55,275 |
| 2021 | $966 | $65,275 | $10,000 | $55,275 |
| 2020 | $949 | $65,275 | $10,000 | $55,275 |
| 2019 | $949 | $51,000 | $7,500 | $43,500 |
| 2018 | $949 | $51,000 | $7,500 | $43,500 |
| 2017 | $949 | $51,000 | $7,500 | $43,500 |
| 2016 | $949 | $51,000 | $7,500 | $43,500 |
| 2015 | -- | $53,700 | $0 | $0 |
| 2014 | $875 | $53,709 | $0 | $0 |
Source: Public Records
Map
Nearby Homes
- 809 Reagan View Ln
- 547 Gazebo Overlook
- 326 Tucker Rd
- 108 Shady Ln
- 212 Simmons Rd
- 404 Cheyenne Trail
- 320 Chilhowee School Rd
- 309 Franklin Meadows Way
- 413 Commanche Trail
- 203 Bar Tall Way
- 309 Boyds Creek Hwy
- 519 Scenic View Dr
- 217 Bar Tall Way
- 225 Wahoo Ct
- 406 Iroquois Ln
- 534 Boyds Creek Hwy
- 525 Hills Gate Cir
- 294 Cherokee Trail
- 0 Cherokee
- 0 Sundial Ln
- 841 Reagan View Ln
- 833 Reagan View Ln
- 0 Reagan View Ln Unit 210404
- Lot 19 Reagan View Ln
- 0 Reagan View Ln
- 829 Reagan View Ln
- 845 Reagan View Ln
- 842 Reagan View Ln
- 846 Reagan View Ln
- 838 Reagan View Ln
- 307 Seymour Heights Dr
- Lot 7 Reagan View Ln
- LOTS 15 & 16 Reagan View Ln
- 850 Reagan View Ln
- 311 Seymour Heights Dr
- Lot 20 Reagan View Ln
- 834 Reagan View Ln
- 825 Reagan View Ln
- 849 Reagan View Ln
- 830 Reagan View Ln