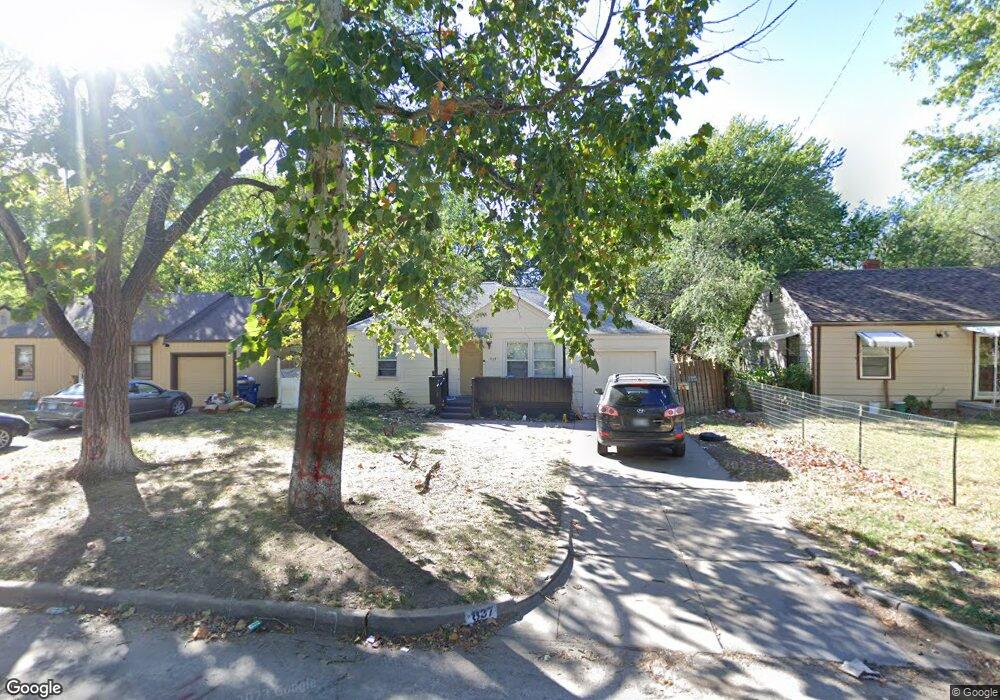
837 S Pinecrest St Wichita, KS 67218
Fabrique NeighborhoodEstimated Value: $93,143 - $128,000
2
Beds
1
Bath
720
Sq Ft
$154/Sq Ft
Est. Value
About This Home
This home is located at 837 S Pinecrest St, Wichita, KS 67218 and is currently estimated at $110,572, approximately $153 per square foot. 837 S Pinecrest St is a home located in Sedgwick County with nearby schools including Caldwell Elementary School, Curtis Middle School, and Wichita Southeast High School.
Ownership History
Date
Name
Owned For
Owner Type
Purchase Details
Closed on
Jun 18, 2009
Sold by
Secretary Of Housing & Urban Development
Bought by
Crow Jerry L
Current Estimated Value
Purchase Details
Closed on
Mar 30, 2006
Sold by
Cone Charlene M
Bought by
Coleman Brice
Home Financials for this Owner
Home Financials are based on the most recent Mortgage that was taken out on this home.
Original Mortgage
$43,299
Interest Rate
6.21%
Mortgage Type
FHA
Purchase Details
Closed on
Nov 19, 1999
Sold by
Perkins Ronald M and Perkins Carolyn J
Bought by
Speck Delbert D and Speck Evelyn M
Home Financials for this Owner
Home Financials are based on the most recent Mortgage that was taken out on this home.
Original Mortgage
$22,000
Interest Rate
7.83%
Create a Home Valuation Report for This Property
The Home Valuation Report is an in-depth analysis detailing your home's value as well as a comparison with similar homes in the area
Home Values in the Area
Average Home Value in this Area
Purchase History
| Date | Buyer | Sale Price | Title Company |
|---|---|---|---|
| Crow Jerry L | -- | 1St Am | |
| Coleman Brice | -- | None Available | |
| Speck Delbert D | -- | Columbian Natl Title Ins Co |
Source: Public Records
Mortgage History
| Date | Status | Borrower | Loan Amount |
|---|---|---|---|
| Previous Owner | Coleman Brice | $43,299 | |
| Previous Owner | Speck Delbert D | $22,000 |
Source: Public Records
Tax History Compared to Growth
Tax History
| Year | Tax Paid | Tax Assessment Tax Assessment Total Assessment is a certain percentage of the fair market value that is determined by local assessors to be the total taxable value of land and additions on the property. | Land | Improvement |
|---|---|---|---|---|
| 2025 | $713 | $8,706 | $2,530 | $6,176 |
| 2023 | $713 | $6,981 | $1,702 | $5,279 |
| 2022 | $621 | $6,118 | $1,610 | $4,508 |
| 2021 | $632 | $5,773 | $966 | $4,807 |
| 2020 | $596 | $5,440 | $966 | $4,474 |
| 2019 | $504 | $4,646 | $966 | $3,680 |
| 2018 | $591 | $5,382 | $966 | $4,416 |
| 2017 | $591 | $0 | $0 | $0 |
| 2016 | $590 | $0 | $0 | $0 |
| 2015 | -- | $0 | $0 | $0 |
| 2014 | -- | $0 | $0 | $0 |
Source: Public Records
Map
Nearby Homes
- 5051 E Lincoln St
- 848 S Beverly Dr
- 903 S Oliver St
- 4901 E Orme St
- 739 S Dellrose St
- 1016 S Pershing Ave
- 539 S Elpyco Ave
- 1038 S Pershing Ave
- 517 Elpyco St
- 5732 Castle Dr
- 5727 Castle Dr
- 739 S Terrace Dr
- 1209 S Pershing Ave
- 1053 S Christine St
- 461 S Elpyco Ave
- 4401 E Lincoln St
- 536 S Terrace Dr
- 4718 & 4720 Arbor St
- 722 S Belmont Ave
- 4714 & 4716 Arbor
- 843 S Pinecrest St
- 831 S Pinecrest St
- 847 S Pinecrest St
- 825 S Pinecrest St
- 834 S Pinecrest St
- 840 S Pinecrest St
- 844 S Pinecrest St
- 819 S Pinecrest St
- 853 S Pinecrest St
- 818 S Bleckley Dr
- 826 S Pinecrest St
- 822 S Bleckley Dr
- 808 S Bleckley Dr
- 820 S Pinecrest St
- 848 S Pinecrest St
- 828 S Bleckley Dr
- 859 S Pinecrest St
- 815 S Pinecrest St
- 852 S Pinecrest St
- 832 S Bleckley Dr