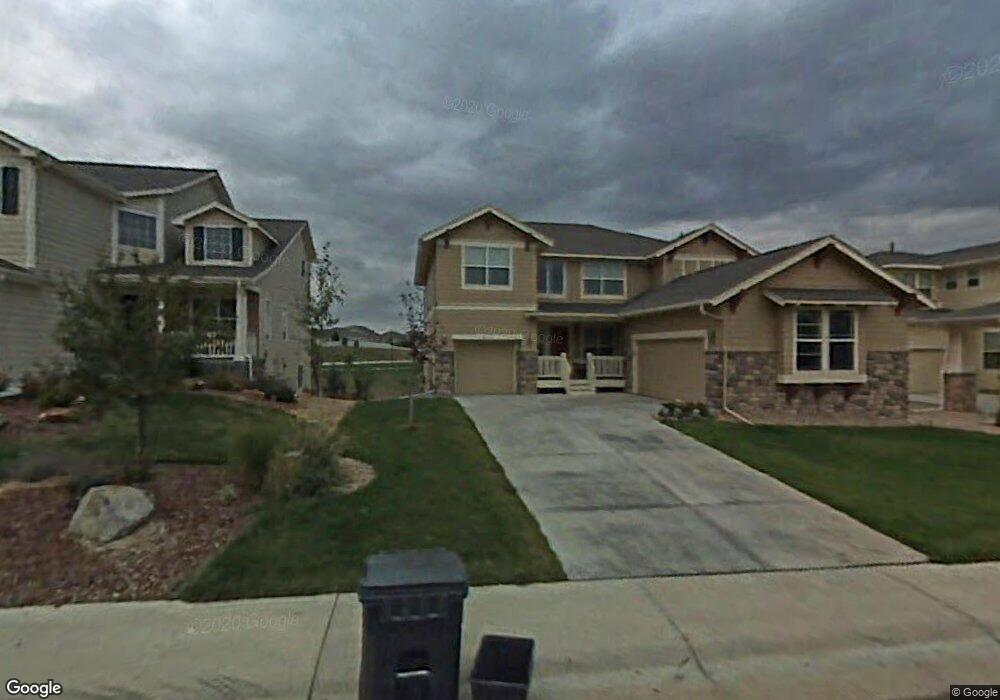
8373 Briar Trace Way Castle Pines, CO 80108
Estimated Value: $799,000 - $841,000
3
Beds
3
Baths
2,748
Sq Ft
$297/Sq Ft
Est. Value
About This Home
This home is located at 8373 Briar Trace Way, Castle Pines, CO 80108 and is currently estimated at $816,953, approximately $297 per square foot. 8373 Briar Trace Way is a home located in Douglas County with nearby schools including Timber Trail Elementary School, Rocky Heights Middle School, and Rock Canyon High School.
Ownership History
Date
Name
Owned For
Owner Type
Purchase Details
Closed on
Aug 16, 2007
Sold by
Chen Henry H and Chan Esther K
Bought by
Knudson Sean and Knudson Jill
Current Estimated Value
Home Financials for this Owner
Home Financials are based on the most recent Mortgage that was taken out on this home.
Original Mortgage
$336,000
Outstanding Balance
$213,064
Interest Rate
6.69%
Mortgage Type
Unknown
Estimated Equity
$603,889
Purchase Details
Closed on
Dec 30, 2004
Sold by
Village Homes Of Colorado Inc
Bought by
Chen Henry H and Chan Esther K
Home Financials for this Owner
Home Financials are based on the most recent Mortgage that was taken out on this home.
Original Mortgage
$188,000
Interest Rate
5.76%
Mortgage Type
Unknown
Create a Home Valuation Report for This Property
The Home Valuation Report is an in-depth analysis detailing your home's value as well as a comparison with similar homes in the area
Home Values in the Area
Average Home Value in this Area
Purchase History
| Date | Buyer | Sale Price | Title Company |
|---|---|---|---|
| Knudson Sean | $420,000 | Security Title | |
| Chen Henry H | $366,277 | Land Title Guarantee Company |
Source: Public Records
Mortgage History
| Date | Status | Borrower | Loan Amount |
|---|---|---|---|
| Open | Knudson Sean | $336,000 | |
| Previous Owner | Chen Henry H | $188,000 |
Source: Public Records
Tax History Compared to Growth
Tax History
| Year | Tax Paid | Tax Assessment Tax Assessment Total Assessment is a certain percentage of the fair market value that is determined by local assessors to be the total taxable value of land and additions on the property. | Land | Improvement |
|---|---|---|---|---|
| 2024 | $5,437 | $58,620 | $10,040 | $48,580 |
| 2023 | $5,489 | $58,620 | $10,040 | $48,580 |
| 2022 | $3,779 | $39,180 | $7,300 | $31,880 |
| 2021 | $3,927 | $39,180 | $7,300 | $31,880 |
| 2020 | $3,926 | $38,860 | $6,950 | $31,910 |
| 2019 | $3,938 | $38,860 | $6,950 | $31,910 |
| 2018 | $3,698 | $35,980 | $5,240 | $30,740 |
| 2017 | $3,474 | $35,980 | $5,240 | $30,740 |
| 2016 | $3,854 | $35,070 | $7,780 | $27,290 |
| 2015 | $4,284 | $35,070 | $7,780 | $27,290 |
| 2014 | $3,785 | $29,550 | $7,320 | $22,230 |
Source: Public Records
Map
Nearby Homes
- 687 Briar Haven Dr
- 8392 Briar Trace Dr
- 8467 Brambleridge Dr
- 860 Bramblewood Dr
- 983 Bramblewood Dr
- 556 Rachael Place
- 1038 Berganot Trail
- 8417 High Ridge Ct
- 8646 Fawnwood Dr
- 8114 Briar Ridge Dr
- 8518 High Ridge Ct
- 7257 Arco Iris Ln
- 1118 Berganot Trail
- 7086 Esperanza Dr
- 8166 Wetherill Cir
- 7224 Serena Dr
- 6987 Esperanza Dr
- 721 Stonemont Ct
- 1229 Berganot Trail
- 1232 Berganot Trail
- 8367 Briar Trace Way
- 8381 Briar Trace Way
- 8361 Briar Trace Way
- 8387 Briar Trace Way
- 8355 Briar Trace Way
- 8364 Briar Trace Way
- 8393 Briar Trace Way
- 8358 Briar Trace Way
- 8382 Briar Trace Way
- 8349 Briar Trace Way
- 8352 Briar Trace Way
- 8399 Briar Trace Way
- 8390 Briar Trace Way
- 8384 Briar Trace Way
- 681 Briar Haven Dr
- 8388 Briar Trace Way
- 8343 Briar Trace Way
- 673 Briar Haven Dr
- 8340 Briar Trace Way
- 667 Briar Haven Dr