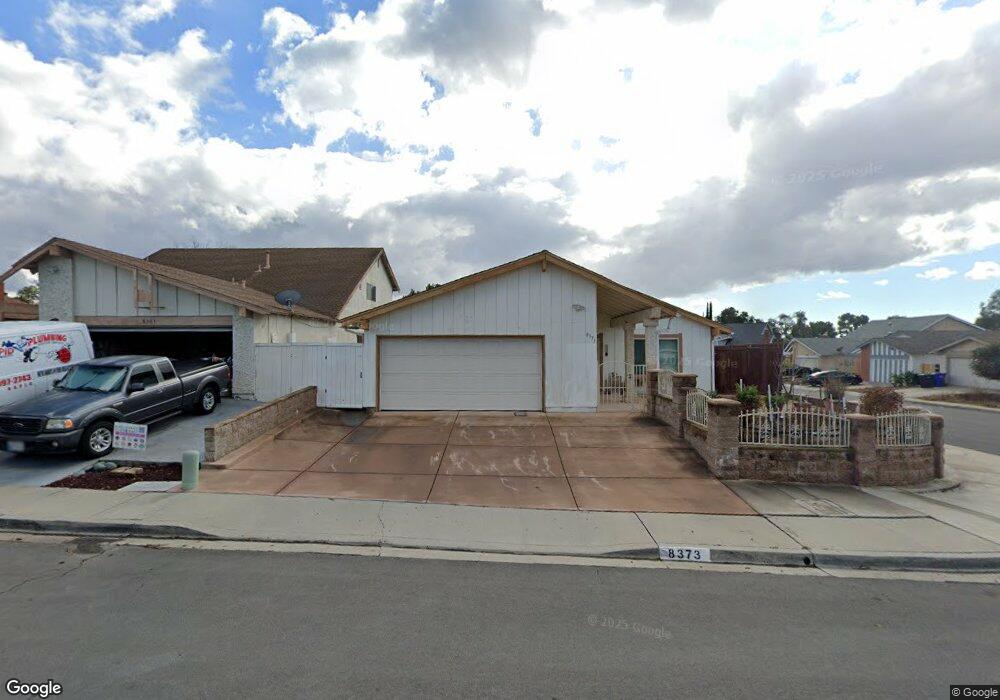
8373 Pallux Way San Diego, CA 92126
Mira Mesa NeighborhoodEstimated Value: $958,255 - $1,101,000
4
Beds
2
Baths
1,614
Sq Ft
$648/Sq Ft
Est. Value
About This Home
This home is located at 8373 Pallux Way, San Diego, CA 92126 and is currently estimated at $1,046,314, approximately $648 per square foot. 8373 Pallux Way is a home located in San Diego County with nearby schools including Ericson Elementary School, Wangenheim Middle School, and Mira Mesa High School.
Ownership History
Date
Name
Owned For
Owner Type
Purchase Details
Closed on
Mar 29, 2016
Sold by
Chan Yin and Huynh Anh My
Bought by
Yin Chan & Anh My Huynh Family Trust and Huynh Anh My
Current Estimated Value
Purchase Details
Closed on
Jul 12, 2000
Sold by
Rindfleisch Steve J and Rindfleisch Wendy L
Bought by
Chan Yin and Huynh Anh My
Home Financials for this Owner
Home Financials are based on the most recent Mortgage that was taken out on this home.
Original Mortgage
$170,000
Outstanding Balance
$60,357
Interest Rate
8.12%
Estimated Equity
$985,957
Purchase Details
Closed on
Sep 25, 1997
Sold by
Rindfleisch M Lucille
Bought by
Rindfleisch Steve J and Rindfleisch Wendy L
Home Financials for this Owner
Home Financials are based on the most recent Mortgage that was taken out on this home.
Original Mortgage
$35,000
Interest Rate
7.49%
Purchase Details
Closed on
Jul 26, 1993
Purchase Details
Closed on
Sep 29, 1987
Purchase Details
Closed on
Sep 30, 1983
Create a Home Valuation Report for This Property
The Home Valuation Report is an in-depth analysis detailing your home's value as well as a comparison with similar homes in the area
Home Values in the Area
Average Home Value in this Area
Purchase History
| Date | Buyer | Sale Price | Title Company |
|---|---|---|---|
| Yin Chan & Anh My Huynh Family Trust | -- | None Available | |
| Chan Yin | $243,000 | Commonwealth Land Title Co | |
| Rindfleisch Steve J | -- | Southland Title Corporation | |
| -- | $162,900 | -- | |
| -- | $132,000 | -- | |
| -- | $106,000 | -- |
Source: Public Records
Mortgage History
| Date | Status | Borrower | Loan Amount |
|---|---|---|---|
| Open | Chan Yin | $170,000 | |
| Previous Owner | Rindfleisch Steve J | $35,000 |
Source: Public Records
Tax History Compared to Growth
Tax History
| Year | Tax Paid | Tax Assessment Tax Assessment Total Assessment is a certain percentage of the fair market value that is determined by local assessors to be the total taxable value of land and additions on the property. | Land | Improvement |
|---|---|---|---|---|
| 2025 | $4,375 | $366,137 | $111,003 | $255,134 |
| 2024 | $4,375 | $358,959 | $108,827 | $250,132 |
| 2023 | $4,276 | $351,922 | $106,694 | $245,228 |
| 2022 | $4,160 | $345,022 | $104,602 | $240,420 |
| 2021 | $4,129 | $338,257 | $102,551 | $235,706 |
| 2020 | $4,079 | $334,790 | $101,500 | $233,290 |
| 2019 | $4,004 | $328,226 | $99,510 | $228,716 |
| 2018 | $3,744 | $321,791 | $97,559 | $224,232 |
| 2017 | $80 | $315,483 | $95,647 | $219,836 |
| 2016 | $3,589 | $309,298 | $93,772 | $215,526 |
| 2015 | $3,536 | $304,653 | $92,364 | $212,289 |
| 2014 | $3,479 | $298,686 | $90,555 | $208,131 |
Source: Public Records
Map
Nearby Homes
- 8468 Calle Morelos
- 8324 Calle Calzada
- 11161 Camino Ruiz Unit 44
- 8393 Capricorn Way Unit 90
- 8446 Summerdale Rd Unit D
- 8388 Summerdale Rd Unit B
- 8446 Summerdale Rd Unit A
- 10948 Worthing Ave
- 11313 Zapata Ave Unit 6
- 11214 Calle Jalapa
- 8365 Westmore Rd Unit 20
- 8595 Summerdale Rd Unit 170
- 11149 Blythe Rd
- 10855 Camino Ruiz Unit 48
- 8686 Perseus Rd
- 10875 Camino Ruiz Unit 50
- 8485 Westmore Rd Unit 40
- 8479 Westmore Rd Unit 55
- 11323 Trebol St
- 8488 New Salem St
- 8383 Pallux Way
- 8370 Borealis Rd
- 8380 Borealis Rd
- 8393 Pallux Way
- 8390 Borealis Rd
- 11042 Virgo Place
- 11034 Virgo Place
- 8370 Pallux Way
- 11050 Virgo Place
- 11026 Virgo Place
- 8380 Pallux Way
- 8405 Pallux Way
- 8410 Borealis Rd
- 11058 Virgo Place
- 8390 Pallux Way
- 11018 Virgo Place
- 11066 Virgo Place
- 8410 Pallux Way
- 8417 Pallux Way
- 8422 Borealis Rd