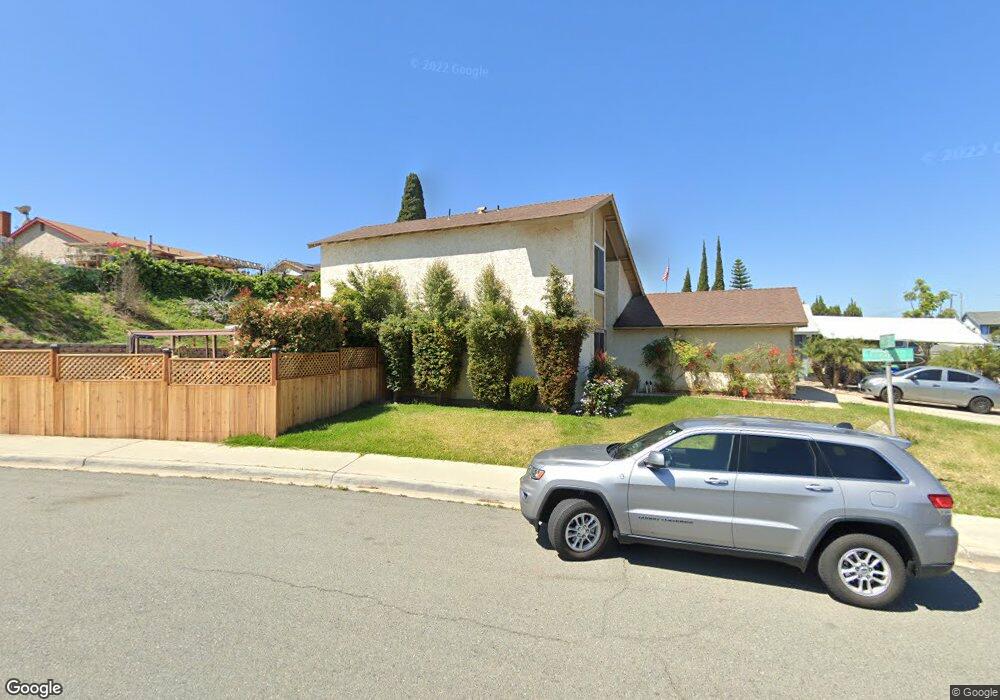
8379 Holt St Spring Valley, CA 91977
Estimated Value: $705,570 - $843,000
4
Beds
2
Baths
1,445
Sq Ft
$529/Sq Ft
Est. Value
About This Home
This home is located at 8379 Holt St, Spring Valley, CA 91977 and is currently estimated at $763,893, approximately $528 per square foot. 8379 Holt St is a home located in San Diego County with nearby schools including Freese Elementary School, Bell Middle School, and Morse High School.
Ownership History
Date
Name
Owned For
Owner Type
Purchase Details
Closed on
Sep 19, 2005
Sold by
Jackson Paskle and Jackson Jeannie M
Bought by
Jackson Paskle and Jackson Jeannie M
Current Estimated Value
Home Financials for this Owner
Home Financials are based on the most recent Mortgage that was taken out on this home.
Original Mortgage
$50,000
Interest Rate
5.81%
Mortgage Type
Credit Line Revolving
Purchase Details
Closed on
Jul 31, 1996
Sold by
Paskle Jackson and Paskle Jeannie M
Bought by
Jackson Paskle and Jackson Jeannie M
Create a Home Valuation Report for This Property
The Home Valuation Report is an in-depth analysis detailing your home's value as well as a comparison with similar homes in the area
Home Values in the Area
Average Home Value in this Area
Purchase History
| Date | Buyer | Sale Price | Title Company |
|---|---|---|---|
| Jackson Paskle | -- | Chicago Title Co | |
| Jackson Paskle | -- | Chicago Title Co | |
| Jackson Paskle | -- | -- |
Source: Public Records
Mortgage History
| Date | Status | Borrower | Loan Amount |
|---|---|---|---|
| Closed | Jackson Paskle | $50,000 |
Source: Public Records
Tax History
| Year | Tax Paid | Tax Assessment Tax Assessment Total Assessment is a certain percentage of the fair market value that is determined by local assessors to be the total taxable value of land and additions on the property. | Land | Improvement |
|---|---|---|---|---|
| 2025 | $1,681 | $92,700 | $21,221 | $71,479 |
| 2024 | $1,681 | $90,883 | $20,805 | $70,078 |
| 2023 | $1,624 | $89,102 | $20,398 | $68,704 |
| 2022 | $1,565 | $87,356 | $19,999 | $67,357 |
| 2021 | $1,562 | $85,644 | $19,607 | $66,037 |
| 2020 | $1,510 | $84,766 | $19,406 | $65,360 |
| 2019 | $1,481 | $83,105 | $19,026 | $64,079 |
| 2018 | $1,368 | $81,476 | $18,653 | $62,823 |
| 2017 | $770 | $79,880 | $18,288 | $61,592 |
| 2016 | $1,253 | $78,315 | $17,930 | $60,385 |
| 2015 | $1,232 | $77,139 | $17,661 | $59,478 |
| 2014 | $1,219 | $75,629 | $17,316 | $58,313 |
Source: Public Records
Map
Nearby Homes
- 220 Worthington St
- 8364 Cacus St
- 302 Worthington St
- 444 Ridgeway Ct Unit 10B4
- 8441 Parkbrook St
- 8582 Parkbrook St
- 458 Ridgeway Ct
- 510 Bluffview Rd
- 8115 Cacus St
- 8535 Paradise Valley Rd Unit 4
- 149 Noeline Way
- 463 Parkbrook St
- 465 Parkbrook St
- 8765 Spring Canyon Dr
- 8753 Spring Canyon Dr
- 8717 Spring Canyon Dr
- 524 Parkbrook St
- 275 S Worthington St Unit SPC 48
- 275 S Worthington St Unit 105
- 275 S Worthington St Unit 124
- 8388 Cacus St
- 8380 Cacus St
- 8371 Holt St
- 8372 Cacus St
- 211 Tarango Place
- 209 Tarango Place
- 218 Tarango Place
- 201 Tarango Place
- 8367 Holt St
- 217 Tarango Place
- 215 Charise Ct
- 8356 Cacus St
- 212 Worthington St
- 8361 Holt St
- 229 Tarango Place
- 221 Charise Ct
- 275103 Worthington St Unit 103
- 230 Tarango Place
- 235 Tarango Place
- 228 Worthington St
Your Personal Tour Guide
Ask me questions while you tour the home.