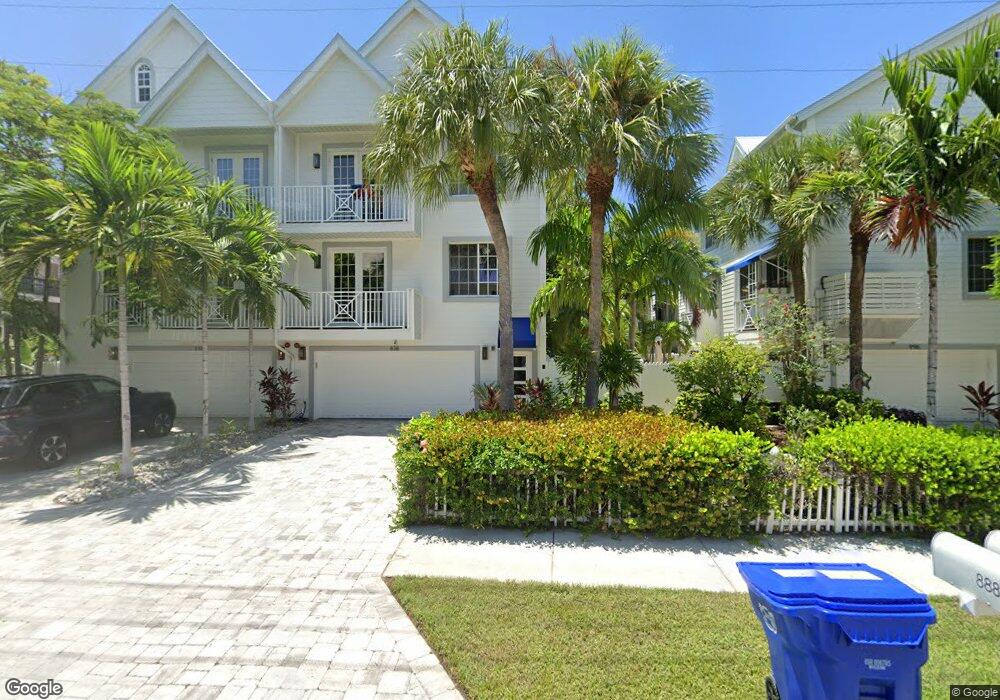
838 10th St S Naples, FL 34102
Downtown Naples NeighborhoodEstimated Value: $1,724,000 - $2,488,000
--
Bed
--
Bath
2,866
Sq Ft
$727/Sq Ft
Est. Value
About This Home
This home is located at 838 10th St S, Naples, FL 34102 and is currently estimated at $2,083,428, approximately $726 per square foot. 838 10th St S is a home located in Collier County with nearby schools including Lake Park Elementary School, Naples High School, and Gulfview Middle School.
Ownership History
Date
Name
Owned For
Owner Type
Purchase Details
Closed on
Sep 17, 2019
Sold by
Winkler Donald and Mark Jackson 2012 Homestead Tr
Bought by
Seman Anthony L and Seman Julie A
Current Estimated Value
Home Financials for this Owner
Home Financials are based on the most recent Mortgage that was taken out on this home.
Original Mortgage
$258,000
Outstanding Balance
$225,988
Interest Rate
3.6%
Mortgage Type
Commercial
Estimated Equity
$1,857,440
Purchase Details
Closed on
Nov 19, 2012
Sold by
Jackson Mark
Bought by
Winkler Donald E
Purchase Details
Closed on
Nov 29, 2001
Sold by
Smith Karen K and Roberts Jane R
Bought by
Jackson Mark
Home Financials for this Owner
Home Financials are based on the most recent Mortgage that was taken out on this home.
Original Mortgage
$388,000
Interest Rate
6.6%
Purchase Details
Closed on
Feb 8, 2001
Sold by
Group 7 Inc
Bought by
Smith Karen K and Roberts Jane R
Create a Home Valuation Report for This Property
The Home Valuation Report is an in-depth analysis detailing your home's value as well as a comparison with similar homes in the area
Home Values in the Area
Average Home Value in this Area
Purchase History
| Date | Buyer | Sale Price | Title Company |
|---|---|---|---|
| Seman Anthony L | $825,000 | Attorney | |
| Winkler Donald E | -- | Attorney | |
| Jackson Mark | $597,000 | -- | |
| Smith Karen K | $434,500 | -- |
Source: Public Records
Mortgage History
| Date | Status | Borrower | Loan Amount |
|---|---|---|---|
| Open | Seman Anthony L | $258,000 | |
| Previous Owner | Jackson Mark | $388,000 |
Source: Public Records
Tax History Compared to Growth
Tax History
| Year | Tax Paid | Tax Assessment Tax Assessment Total Assessment is a certain percentage of the fair market value that is determined by local assessors to be the total taxable value of land and additions on the property. | Land | Improvement |
|---|---|---|---|---|
| 2025 | $12,056 | $1,360,700 | -- | $1,360,700 |
| 2024 | $11,823 | $1,360,700 | -- | $1,360,700 |
| 2023 | $11,823 | $1,273,041 | $0 | $0 |
| 2022 | $11,847 | $1,157,310 | $0 | $0 |
| 2021 | $10,796 | $1,052,100 | $0 | $1,052,100 |
| 2020 | $10,680 | $1,052,100 | $0 | $1,052,100 |
| 2019 | $11,526 | $1,123,080 | $0 | $1,123,080 |
| 2018 | $5,790 | $602,873 | $0 | $0 |
| 2017 | $5,697 | $590,473 | $0 | $0 |
| 2016 | $5,597 | $578,328 | $0 | $0 |
| 2015 | $5,714 | $574,308 | $0 | $0 |
| 2014 | $5,734 | $519,750 | $0 | $0 |
Source: Public Records
Map
Nearby Homes
- 900 8th Ave S Unit 105
- 900 8th Ave S Unit 204
- 900 8th Ave S Unit 104
- 975 9th Ave S Unit 19
- 975 9th Ave S Unit 11
- 975 9th Ave S Unit 2
- 927 8th Ave S Unit 927
- 880 8th Ave S Unit 202
- 950 7th Ave S Unit 14
- 980 7th Ave S Unit 109
- 980 7th Ave S Unit 107
- 980 7th Ave S Unit 104
- 863 9th Ave S Unit 202
- 721 9th St S Unit 1
- 721 9th St S Unit 4
- 750 11th St S Unit C
- 838 10th St S Unit 102
- 888 10th St S Unit 101
- 888 10th St S
- 980 8th Ave S Unit 201
- 988 8th Ave S Unit 202
- 988 8th Ave S
- 996 8th St S
- 996 8th Ave S Unit 203
- 996 8th Ave S
- 995 9th Ave S Unit 5
- 995 9th Ave S Unit 4
- 995 9th Ave S Unit 2
- 995 9th Ave S Unit 3
- 995 9th Ave S
- 995 9th Ave S Unit 6
- 995 9th Ave S Unit 1
- 964 8th Ave S Unit B2
- 962 8th Ave S Unit A2
- 958 8th Ave S
- 958 8th Ave S Unit B1