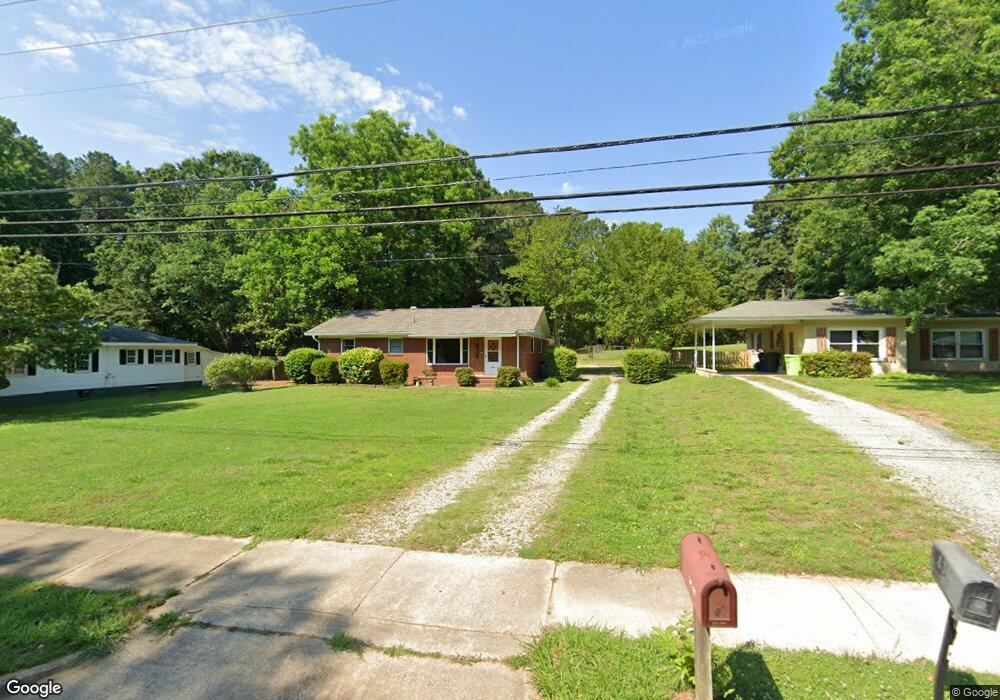
838 Athens Dr Raleigh, NC 27606
Estimated Value: $418,278 - $552,000
--
Bed
1
Bath
1,606
Sq Ft
$282/Sq Ft
Est. Value
About This Home
This home is located at 838 Athens Dr, Raleigh, NC 27606 and is currently estimated at $453,320, approximately $282 per square foot. 838 Athens Dr is a home located in Wake County with nearby schools including Farmington Woods Elementary, Leroy Martin Magnet, and Learn With The Best School.
Ownership History
Date
Name
Owned For
Owner Type
Purchase Details
Closed on
Jul 15, 2021
Sold by
Shults Karen L
Bought by
Huckabee Alix Leonard
Current Estimated Value
Home Financials for this Owner
Home Financials are based on the most recent Mortgage that was taken out on this home.
Original Mortgage
$255,000
Outstanding Balance
$238,007
Interest Rate
5%
Mortgage Type
New Conventional
Estimated Equity
$215,313
Purchase Details
Closed on
Jul 30, 2013
Sold by
Shults Karen L
Bought by
Shults Karen L
Purchase Details
Closed on
Jun 25, 2009
Sold by
Shults Karen L and Atkins David L
Bought by
Shults Karen L
Home Financials for this Owner
Home Financials are based on the most recent Mortgage that was taken out on this home.
Original Mortgage
$80,000
Interest Rate
4.79%
Mortgage Type
New Conventional
Purchase Details
Closed on
Oct 22, 2007
Sold by
Atkins Bonnie H
Bought by
Atkins David L and Shults Karen L
Create a Home Valuation Report for This Property
The Home Valuation Report is an in-depth analysis detailing your home's value as well as a comparison with similar homes in the area
Home Values in the Area
Average Home Value in this Area
Purchase History
| Date | Buyer | Sale Price | Title Company |
|---|---|---|---|
| Huckabee Alix Leonard | $340,000 | None Listed On Document | |
| Huckabee Alix Leonard | $340,000 | None Listed On Document | |
| Shults Karen L | -- | None Available | |
| Shults Karen L | $35,000 | None Available | |
| Atkins David L | -- | None Available |
Source: Public Records
Mortgage History
| Date | Status | Borrower | Loan Amount |
|---|---|---|---|
| Open | Huckabee Alix Leonard | $255,000 | |
| Closed | Huckabee Alix Leonard | $255,000 | |
| Previous Owner | Shults Karen L | $80,000 |
Source: Public Records
Tax History Compared to Growth
Tax History
| Year | Tax Paid | Tax Assessment Tax Assessment Total Assessment is a certain percentage of the fair market value that is determined by local assessors to be the total taxable value of land and additions on the property. | Land | Improvement |
|---|---|---|---|---|
| 2025 | $3,257 | $371,222 | $143,550 | $227,672 |
| 2024 | $3,244 | $371,222 | $143,550 | $227,672 |
| 2023 | $2,581 | $234,953 | $99,000 | $135,953 |
| 2022 | $2,399 | $234,953 | $99,000 | $135,953 |
| 2021 | $2,306 | $234,953 | $99,000 | $135,953 |
| 2020 | $2,264 | $234,953 | $99,000 | $135,953 |
| 2019 | $1,850 | $157,880 | $65,450 | $92,430 |
| 2018 | $1,745 | $157,880 | $65,450 | $92,430 |
| 2017 | $1,662 | $157,880 | $65,450 | $92,430 |
| 2016 | $1,628 | $157,880 | $65,450 | $92,430 |
| 2015 | $1,600 | $152,594 | $62,000 | $90,594 |
| 2014 | $1,518 | $152,594 | $62,000 | $90,594 |
Source: Public Records
Map
Nearby Homes
- 5061 Lundy Dr Unit 102
- 5061 Lundy Dr Unit 101
- 5053 Lundy Dr Unit 101
- 322 Jones Franklin Rd
- 5049 Lundy Dr Unit 102
- 5045 Lundy Dr Unit 101
- 944 Athens Dr
- 808 Ravenwood Dr
- 5257 Vann St
- 5520 Kaplan Dr
- 149 Jones Franklin Rd Unit A
- 4812 Blue Bird Ct Unit C
- 4822 Blue Bird Ct Unit B
- 4818 Blue Bird Ct Unit C
- 222 Wilmot Dr
- 2114 Scarlet Maple Dr
- 5401 Kaplan Dr
- Lot 14 Grayhaven Place
- 330 Wilmot Dr
- 712 Grayhaven Place
- 834 Athens Dr
- 842 Athens Dr
- 844 Athens Dr
- 844 Athens Dr Unit F
- 844 Athens Dr Unit D
- 844 Athens Dr Unit C
- 844 Athens Dr Unit B
- 844 Athens Dr Unit A
- 844 Athens Dr Unit E
- 828 Athens Dr
- 325 Jones Franklin Rd
- 319 Jones Franklin Rd
- 824 Athens Dr
- 329 Jones Franklin Rd
- 850 Athens Dr
- 809 Pirouette Ct
- 333 Jones Franklin Rd
- 317 Jones Franklin Rd
- 805 Pirouette Ct
- 845 Athens Dr Unit 102