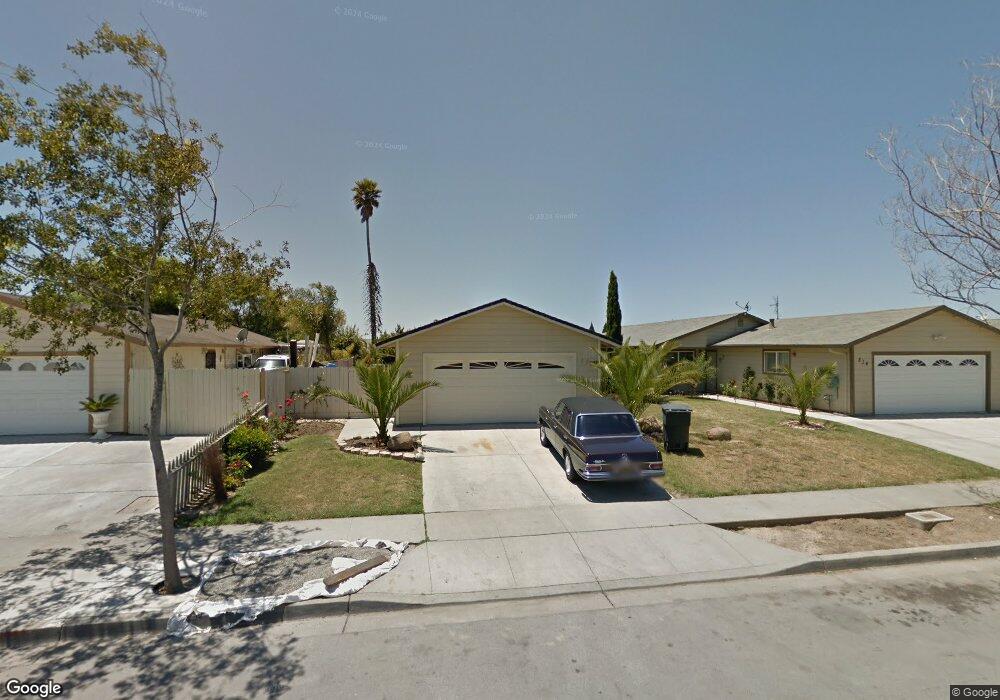
838 Bermuda Way Salinas, CA 93905
East Salinas NeighborhoodEstimated Value: $617,175 - $702,000
3
Beds
2
Baths
1,287
Sq Ft
$513/Sq Ft
Est. Value
About This Home
This home is located at 838 Bermuda Way, Salinas, CA 93905 and is currently estimated at $660,044, approximately $512 per square foot. 838 Bermuda Way is a home located in Monterey County with nearby schools including Frank Paul Elementary School, La Paz Middle School, and Alisal High School.
Ownership History
Date
Name
Owned For
Owner Type
Purchase Details
Closed on
Oct 10, 2005
Sold by
Esquivel Jose G and Rangel Carolina
Bought by
Esquivel Jose G
Current Estimated Value
Home Financials for this Owner
Home Financials are based on the most recent Mortgage that was taken out on this home.
Original Mortgage
$313,500
Outstanding Balance
$166,847
Interest Rate
5.67%
Mortgage Type
New Conventional
Estimated Equity
$493,197
Purchase Details
Closed on
Sep 2, 2004
Sold by
Esquivel Jose Guadalupe Rangel
Bought by
Esquivel Jose Guadalupe Rangel and Rangel Carolina
Purchase Details
Closed on
Nov 16, 2001
Sold by
Alvarez Abel and Zamora Jose M
Bought by
Esquibel Jose Guadalupe Rangel
Purchase Details
Closed on
Jun 20, 1999
Sold by
Rider Property Development
Bought by
Alvarez Abel and Zamora Jose M
Home Financials for this Owner
Home Financials are based on the most recent Mortgage that was taken out on this home.
Original Mortgage
$129,600
Interest Rate
7.05%
Create a Home Valuation Report for This Property
The Home Valuation Report is an in-depth analysis detailing your home's value as well as a comparison with similar homes in the area
Home Values in the Area
Average Home Value in this Area
Purchase History
| Date | Buyer | Sale Price | Title Company |
|---|---|---|---|
| Esquivel Jose G | -- | -- | |
| Esquivel Jose Guadalupe Rangel | -- | -- | |
| Esquibel Jose Guadalupe Rangel | -- | -- | |
| Alvarez Abel | $162,000 | Stewart Title |
Source: Public Records
Mortgage History
| Date | Status | Borrower | Loan Amount |
|---|---|---|---|
| Open | Esquivel Jose G | $313,500 | |
| Previous Owner | Alvarez Abel | $129,600 |
Source: Public Records
Tax History
| Year | Tax Paid | Tax Assessment Tax Assessment Total Assessment is a certain percentage of the fair market value that is determined by local assessors to be the total taxable value of land and additions on the property. | Land | Improvement |
|---|---|---|---|---|
| 2025 | $4,012 | $311,638 | $139,583 | $172,055 |
| 2024 | $4,012 | $305,529 | $136,847 | $168,682 |
| 2023 | $3,936 | $299,539 | $134,164 | $165,375 |
| 2022 | $3,541 | $293,667 | $131,534 | $162,133 |
| 2021 | $3,541 | $287,909 | $128,955 | $158,954 |
| 2020 | $3,502 | $284,958 | $127,633 | $157,325 |
| 2019 | $3,611 | $279,372 | $125,131 | $154,241 |
| 2018 | $3,402 | $273,895 | $122,678 | $151,217 |
| 2017 | $3,530 | $268,525 | $120,273 | $148,252 |
| 2016 | $3,347 | $263,261 | $117,915 | $145,346 |
| 2015 | $3,317 | $259,307 | $116,144 | $143,163 |
| 2014 | $2,669 | $213,000 | $95,000 | $118,000 |
Source: Public Records
Map
Nearby Homes
- 755 Pino Way
- 11 Manzano Cir
- 948 Rider Ave
- 1094 Twin Creeks Dr
- 1544 Saguaro Dr Unit 4
- 1049 Twin Creeks Dr
- 709 Gee St
- 11 Saguaro Cir
- 933 Acosta Plaza Unit 35
- 1725 Great Island St
- 15 Cheswick Cir
- 11 E Laurel Dr
- 11 Hill Cir
- 609 Saint George Dr
- 1914 Whitman St
- 1858 Bradbury St
- 544 Saint George Dr
- 1671 Cambrian Dr
- 1215 Campania Way
- 1918 Bradbury St
- 842 Bermuda Way
- 834 Bermuda Way
- 1245 Tahiti Place
- 846 Bermuda Way
- 830 Bermuda Way
- 1242 Tahiti Place
- 1241 Tahiti Place
- 826 Bermuda Way
- 850 Bermuda Way
- 1245 Pacific Ave
- 839 Bermuda Way
- 843 Bermuda Way
- 835 Bermuda Way
- 847 Bermuda Way
- 831 Bermuda Way
- 1241 Pacific Ave
- 822 Bermuda Way
- 1238 Tahiti Place
- 827 Bermuda Way
- 851 Bermuda Way
Your Personal Tour Guide
Ask me questions while you tour the home.