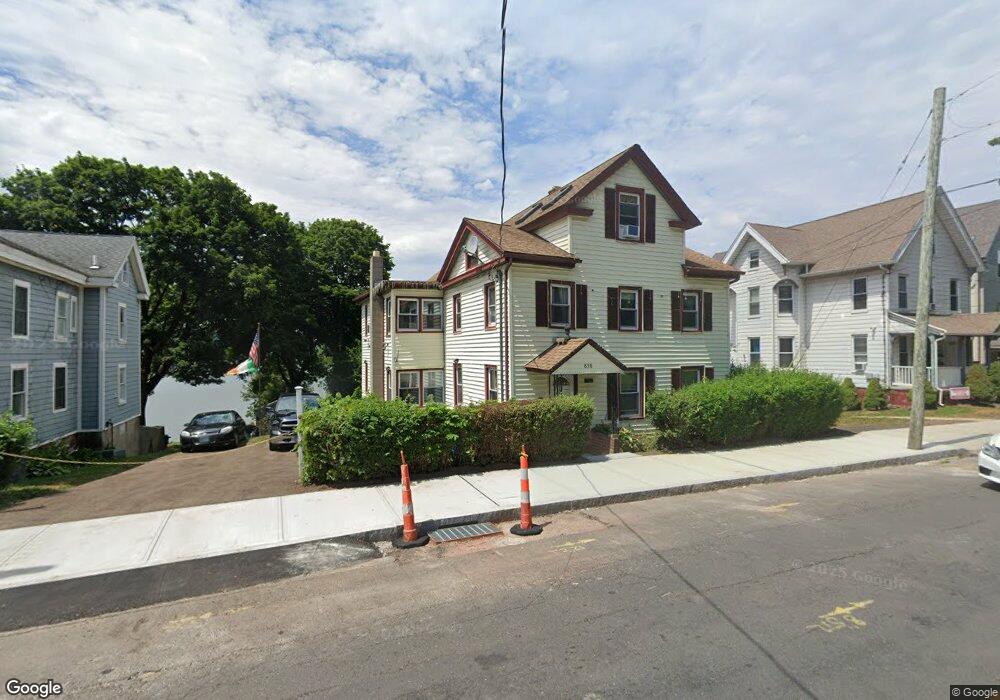
838 Quinnipiac Ave New Haven, CT 06513
Quinnipiac Meadows NeighborhoodEstimated Value: $310,000 - $598,000
4
Beds
2
Baths
2,402
Sq Ft
$195/Sq Ft
Est. Value
About This Home
This home is located at 838 Quinnipiac Ave, New Haven, CT 06513 and is currently estimated at $467,593, approximately $194 per square foot. 838 Quinnipiac Ave is a home located in New Haven County with nearby schools including Ross Woodward, St Francis & St Rose Of Lima School, and All Nations Christian Academy.
Ownership History
Date
Name
Owned For
Owner Type
Purchase Details
Closed on
Jun 27, 2023
Sold by
Adinolfi Salvatore
Bought by
Mullon Michael C and Adinolfi Kelley
Current Estimated Value
Home Financials for this Owner
Home Financials are based on the most recent Mortgage that was taken out on this home.
Original Mortgage
$130,545
Outstanding Balance
$127,193
Interest Rate
6.39%
Mortgage Type
FHA
Estimated Equity
$340,400
Create a Home Valuation Report for This Property
The Home Valuation Report is an in-depth analysis detailing your home's value as well as a comparison with similar homes in the area
Home Values in the Area
Average Home Value in this Area
Purchase History
| Date | Buyer | Sale Price | Title Company |
|---|---|---|---|
| Mullon Michael C | $184,000 | None Available |
Source: Public Records
Mortgage History
| Date | Status | Borrower | Loan Amount |
|---|---|---|---|
| Open | Mullon Michael C | $130,545 |
Source: Public Records
Tax History Compared to Growth
Tax History
| Year | Tax Paid | Tax Assessment Tax Assessment Total Assessment is a certain percentage of the fair market value that is determined by local assessors to be the total taxable value of land and additions on the property. | Land | Improvement |
|---|---|---|---|---|
| 2025 | $10,210 | $259,140 | $118,860 | $140,280 |
| 2024 | $9,977 | $259,140 | $118,860 | $140,280 |
| 2023 | $9,640 | $259,140 | $118,860 | $140,280 |
| 2022 | $10,301 | $259,140 | $118,860 | $140,280 |
| 2021 | $5,971 | $136,080 | $41,090 | $94,990 |
| 2020 | $5,971 | $136,080 | $41,090 | $94,990 |
| 2019 | $5,849 | $136,080 | $41,090 | $94,990 |
| 2018 | $5,849 | $136,080 | $41,090 | $94,990 |
| 2017 | $5,264 | $136,080 | $41,090 | $94,990 |
| 2016 | $5,846 | $140,700 | $61,670 | $79,030 |
| 2015 | $5,846 | $140,700 | $61,670 | $79,030 |
| 2014 | $5,846 | $140,700 | $61,670 | $79,030 |
Source: Public Records
Map
Nearby Homes
- 916 Quinnipiac Ave Unit 2
- 932 Quinnipiac Ave Unit 5
- 926 Quinnipiac Ave Unit 1
- 926 Quinnipiac Ave Unit 8
- 728 Quinnipiac Ave
- 714 Quinnipiac Ave
- 686 Quinnipiac Ave
- 674 Quinnipiac Ave
- 25 Pine St
- 314 Lenox St
- 22 Downing St
- 54 Lombard St
- 290 Eastern St
- 22 Marie St
- 31 Marie St Unit B
- 265 Lexington Ave
- 100 Front St Unit 100
- 116 E Pearl St
- 147 Lombard St
- 533 Quinnipiac Ave
- 850 Quinnipiac Ave Unit 14
- 850 Quinnipiac Ave Unit 13
- 850 Quinnipiac Ave Unit 12
- 832 Quinnipiac Ave
- 844 Quinnipiac Ave
- 844 Quinnipiac Ave Unit 1st
- 826 Quinnipiac Ave
- 822 Quinnipiac Ave
- 852 Quinnipiac Ave Unit 11
- 852 Quinnipiac Ave Unit 10
- 852 Quinnipiac Ave Unit 9
- 854 Quinnipiac Ave Unit 8
- 854 Quinnipiac Ave Unit 7
- 856 Quinnipiac Ave Unit 6
- 856 Quinnipiac Ave Unit 5
- 858 Quinnipiac Ave Unit 3
- 858 Quinnipiac Ave Unit 2
- 858 Quinnipiac Ave Unit 1
- 858 Quinnipiac Ave
- 856 Quinnipiac Ave