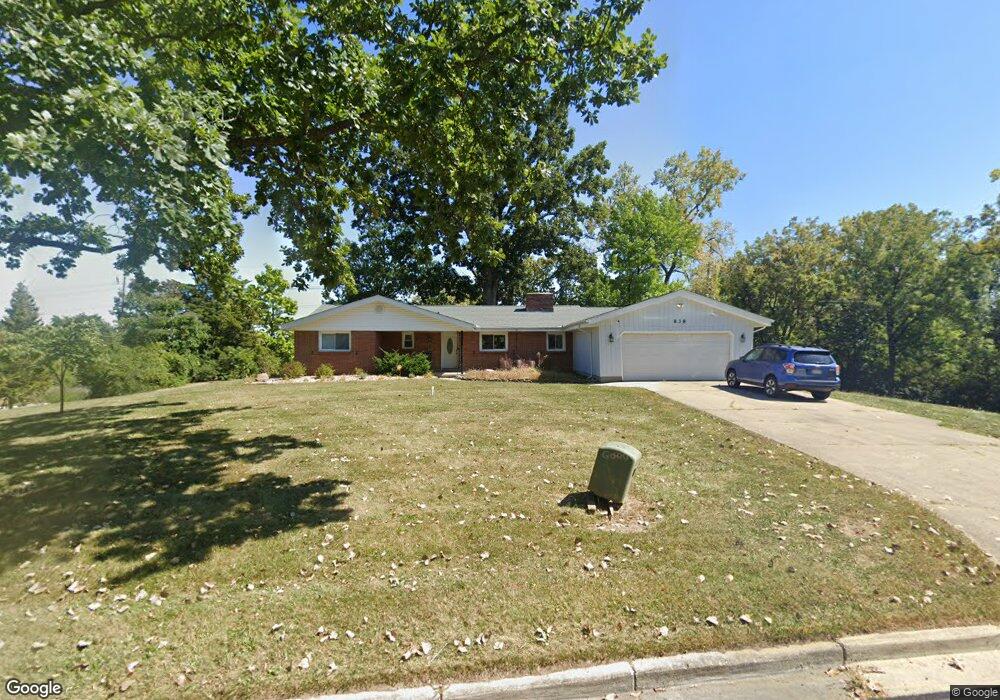
838 S Elm St Dayton, OH 45449
Estimated Value: $241,000 - $306,000
4
Beds
2
Baths
1,916
Sq Ft
$147/Sq Ft
Est. Value
About This Home
This home is located at 838 S Elm St, Dayton, OH 45449 and is currently estimated at $282,004, approximately $147 per square foot. 838 S Elm St is a home located in Montgomery County with nearby schools including West Carrollton High School, Miami Valley Academies, and Bethel Baptist School.
Ownership History
Date
Name
Owned For
Owner Type
Purchase Details
Closed on
Feb 6, 2020
Sold by
Naydore Ilya
Bought by
Josken Jeff and Powell Amber
Current Estimated Value
Home Financials for this Owner
Home Financials are based on the most recent Mortgage that was taken out on this home.
Original Mortgage
$164,000
Outstanding Balance
$145,828
Interest Rate
3.6%
Mortgage Type
New Conventional
Estimated Equity
$142,780
Purchase Details
Closed on
Jan 10, 2018
Sold by
Fannie Mae
Bought by
Naydorf Iiya
Purchase Details
Closed on
Nov 29, 2016
Sold by
Cecil Janet and Ditech Financial Llc
Bought by
Federal National Mortgage Association
Purchase Details
Closed on
Aug 14, 2006
Sold by
Schuman Joseph and Schuman Lisa G
Bought by
Cecil Charles
Home Financials for this Owner
Home Financials are based on the most recent Mortgage that was taken out on this home.
Original Mortgage
$116,000
Interest Rate
6.88%
Mortgage Type
Stand Alone First
Purchase Details
Closed on
Oct 24, 2000
Sold by
Schuman Eugene E Tr
Bought by
Schuman Joseph and Schuman Dawn
Create a Home Valuation Report for This Property
The Home Valuation Report is an in-depth analysis detailing your home's value as well as a comparison with similar homes in the area
Home Values in the Area
Average Home Value in this Area
Purchase History
| Date | Buyer | Sale Price | Title Company |
|---|---|---|---|
| Josken Jeff | $205,000 | Ahta | |
| Naydorf Iiya | -- | Omega Title Agency Llc | |
| Federal National Mortgage Association | $84,000 | None Available | |
| Cecil Charles | $145,000 | None Available | |
| Schuman Joseph | -- | -- |
Source: Public Records
Mortgage History
| Date | Status | Borrower | Loan Amount |
|---|---|---|---|
| Open | Josken Jeff | $164,000 |
Source: Public Records
Tax History Compared to Growth
Tax History
| Year | Tax Paid | Tax Assessment Tax Assessment Total Assessment is a certain percentage of the fair market value that is determined by local assessors to be the total taxable value of land and additions on the property. | Land | Improvement |
|---|---|---|---|---|
| 2024 | $4,453 | $72,620 | $22,530 | $50,090 |
| 2023 | $4,453 | $72,620 | $22,530 | $50,090 |
| 2022 | $4,260 | $54,610 | $16,940 | $37,670 |
| 2021 | $4,352 | $54,610 | $16,940 | $37,670 |
| 2020 | $4,267 | $54,610 | $16,940 | $37,670 |
| 2019 | $4,153 | $48,050 | $16,940 | $31,110 |
| 2018 | $3,896 | $48,050 | $16,940 | $31,110 |
| 2017 | $5,084 | $48,050 | $16,940 | $31,110 |
| 2016 | $2,824 | $43,270 | $16,940 | $26,330 |
| 2015 | $2,530 | $43,270 | $16,940 | $26,330 |
| 2014 | $2,530 | $43,270 | $16,940 | $26,330 |
| 2012 | -- | $46,380 | $16,940 | $29,440 |
Source: Public Records
Map
Nearby Homes
- 1100 S Elm St
- 261 Trumpet Dr
- 275 Orchard Hill Dr
- 438 Crusader Dr
- 432 Crusader Dr
- 1153 King Richard Pkwy
- 500 Lincoln Green Dr
- 2125 Sherwood Forest Dr
- 609 Kings Cross Ct
- 1000 Skyview Dr
- 626 Upland Dr
- 429 Wilson Park Dr
- 26 Southard Ln
- 624 Skyview Dr
- 1320 S Alex Rd
- 330 Ellenwood Dr
- 1803 Cudgell Dr
- 354 Ellenwood Dr
- 776 Arenel Dr
- 340 S Elm St
- 330 Greenport Dr
- 200 Vinemont Dr
- 340 Greenport Dr
- 844 S Elm St
- 832 S Elm St
- 311 Ridgecrest Dr
- 835 S Elm St
- 350 Greenport Dr
- 341 Greenport Dr
- 841 S Elm St
- 315 Ridgecrest Dr
- 361 Greenport Dr
- 310 Ridgecrest Dr
- 4399 Orchard Hill Dr
- 360 Greenport Dr
- 320 Ridgecrest Dr
- 845 S Elm St
- 221 Orchard Hill Dr
- 371 Greenport Dr
- 319 Ridgecrest Dr