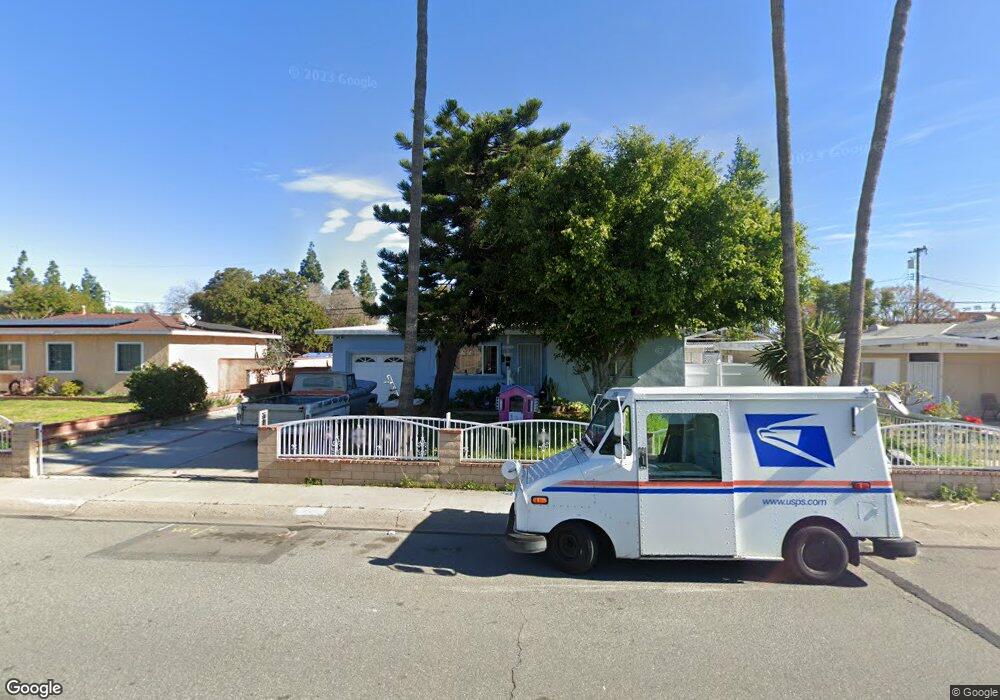
838 Tafolla St Placentia, CA 92870
Estimated Value: $654,816 - $708,000
2
Beds
1
Bath
1,079
Sq Ft
$634/Sq Ft
Est. Value
About This Home
This home is located at 838 Tafolla St, Placentia, CA 92870 and is currently estimated at $684,454, approximately $634 per square foot. 838 Tafolla St is a home located in Orange County with nearby schools including Melrose Elementary School, Valadez Middle School Academy, and Valencia High School.
Ownership History
Date
Name
Owned For
Owner Type
Purchase Details
Closed on
Sep 26, 2024
Sold by
Esquivel Francisco J and Esquivel Graciela M
Bought by
Esquivel Mares Living Trust and Esquivel
Current Estimated Value
Purchase Details
Closed on
Apr 13, 2015
Sold by
Esquivel Francisco J and Esquivel Graciela M
Bought by
Esquivel Francisco J and Esquivel Graciela M
Home Financials for this Owner
Home Financials are based on the most recent Mortgage that was taken out on this home.
Original Mortgage
$103,420
Interest Rate
3.7%
Mortgage Type
New Conventional
Purchase Details
Closed on
Apr 5, 1994
Sold by
Ulibarri Pilo G and Ulibarri Johanna M
Bought by
Esquivel Javier R and Esquivel Graciela M
Home Financials for this Owner
Home Financials are based on the most recent Mortgage that was taken out on this home.
Original Mortgage
$130,150
Interest Rate
4.5%
Purchase Details
Closed on
Jan 11, 1994
Sold by
Verges John P
Bought by
Ulibarri Pilo G
Create a Home Valuation Report for This Property
The Home Valuation Report is an in-depth analysis detailing your home's value as well as a comparison with similar homes in the area
Home Values in the Area
Average Home Value in this Area
Purchase History
| Date | Buyer | Sale Price | Title Company |
|---|---|---|---|
| Esquivel Mares Living Trust | -- | None Listed On Document | |
| Esquivel Francisco J | -- | Stewart | |
| Esquivel Javier R | $137,000 | North American Title Co | |
| Ulibarri Pilo G | $1,000 | -- |
Source: Public Records
Mortgage History
| Date | Status | Borrower | Loan Amount |
|---|---|---|---|
| Previous Owner | Esquivel Francisco J | $103,420 | |
| Previous Owner | Esquivel Javier R | $130,150 |
Source: Public Records
Tax History
| Year | Tax Paid | Tax Assessment Tax Assessment Total Assessment is a certain percentage of the fair market value that is determined by local assessors to be the total taxable value of land and additions on the property. | Land | Improvement |
|---|---|---|---|---|
| 2025 | $3,302 | $232,842 | $172,732 | $60,110 |
| 2024 | $3,302 | $228,277 | $169,345 | $58,932 |
| 2023 | $3,212 | $223,801 | $166,024 | $57,777 |
| 2022 | $3,134 | $219,413 | $162,768 | $56,645 |
| 2021 | $3,033 | $215,111 | $159,576 | $55,535 |
| 2020 | $3,041 | $212,906 | $157,940 | $54,966 |
| 2019 | $2,911 | $208,732 | $154,843 | $53,889 |
| 2018 | $2,871 | $204,640 | $151,807 | $52,833 |
| 2017 | $2,821 | $200,628 | $148,830 | $51,798 |
| 2016 | $2,766 | $196,695 | $145,912 | $50,783 |
| 2015 | $2,651 | $193,741 | $143,720 | $50,021 |
| 2014 | -- | $189,946 | $140,904 | $49,042 |
Source: Public Records
Map
Nearby Homes
- 929 Gonzales St
- 325 W La Jolla St
- 161 E Orangethorpe Ave Unit 65
- 161 E Orangethorpe Ave Unit 81
- 161 E Orangethorpe Ave Unit 163
- 650 Kansas Ave
- 1017 Avenida de Pio Pico
- 215 Lakepark Dr
- 712 Oriole Ave
- 235 Lakepark Dr Unit 89
- 2546 E Park Ln
- 906 Easton St
- 315 Baker St
- 412 W Santa fe Ave
- 201 S Melrose St
- 2470 Santa Clara Ave
- 2518 Pearson Ave
- 338 Molokai Dr
- 1250 N State College Blvd Unit 19
- 102 Kauai Ln
- 832 Tafolla St
- 844 Tafolla St
- 837 S Melrose St
- 843 S Melrose St
- 831 S Melrose St
- 826 Tafolla St
- 850 Tafolla St
- 831 Tafolla St
- 843 Tafolla St
- 849 S Melrose St
- 825 S Melrose St
- 902 Tafolla St
- 825 Tafolla St
- 820 Tafolla St
- 849 Tafolla St
- 901 S Melrose St
- 908 Tafolla St
- 819 S Melrose St
- 901 Tafolla St
- 819 Tafolla St
Your Personal Tour Guide
Ask me questions while you tour the home.