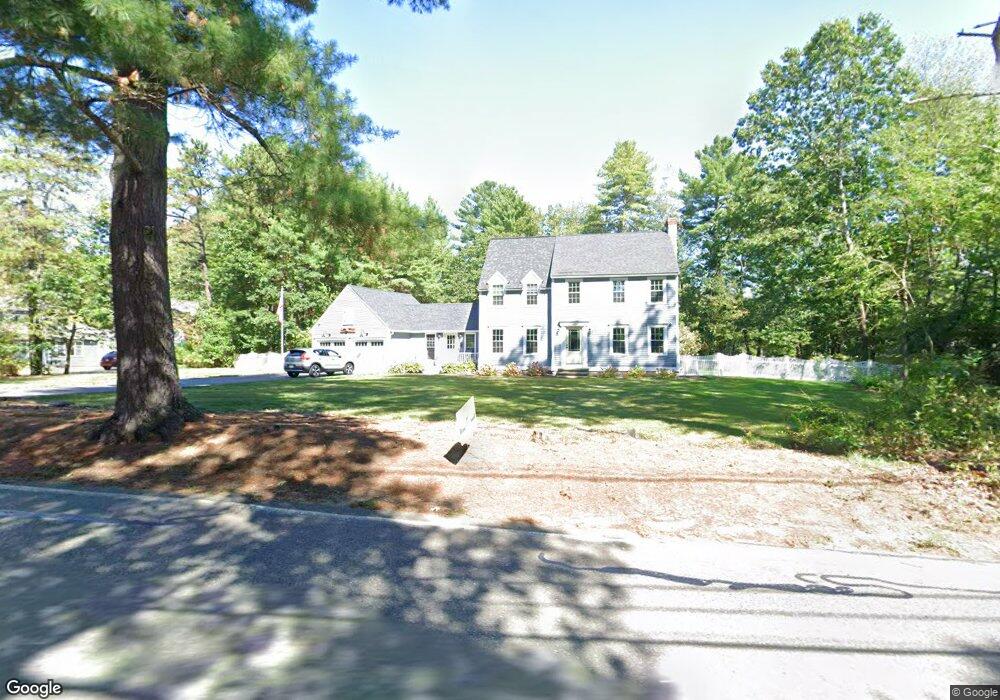
838 Townsend Rd Groton, MA 01450
Estimated Value: $670,673 - $812,000
3
Beds
3
Baths
1,865
Sq Ft
$392/Sq Ft
Est. Value
About This Home
This home is located at 838 Townsend Rd, Groton, MA 01450 and is currently estimated at $731,168, approximately $392 per square foot. 838 Townsend Rd is a home located in Middlesex County with nearby schools including Groton Dunstable Regional High School.
Ownership History
Date
Name
Owned For
Owner Type
Purchase Details
Closed on
Dec 28, 1999
Sold by
Burke Lisa A and Burke Daniel J
Bought by
Murray Michael P and Murray Rochelle T
Current Estimated Value
Home Financials for this Owner
Home Financials are based on the most recent Mortgage that was taken out on this home.
Original Mortgage
$215,900
Interest Rate
7.61%
Mortgage Type
Purchase Money Mortgage
Purchase Details
Closed on
Jul 26, 1994
Sold by
Wolff Alan L and Wolff Rosemary L
Bought by
Burke Lisa A and Burke Daniel J
Create a Home Valuation Report for This Property
The Home Valuation Report is an in-depth analysis detailing your home's value as well as a comparison with similar homes in the area
Home Values in the Area
Average Home Value in this Area
Purchase History
| Date | Buyer | Sale Price | Title Company |
|---|---|---|---|
| Murray Michael P | $269,900 | -- | |
| Burke Lisa A | $183,500 | -- | |
| Burke Lisa A | $183,500 | -- |
Source: Public Records
Mortgage History
| Date | Status | Borrower | Loan Amount |
|---|---|---|---|
| Open | Burke Lisa A | $281,000 | |
| Closed | Burke Lisa A | $215,900 | |
| Previous Owner | Burke Lisa A | $130,000 |
Source: Public Records
Tax History
| Year | Tax Paid | Tax Assessment Tax Assessment Total Assessment is a certain percentage of the fair market value that is determined by local assessors to be the total taxable value of land and additions on the property. | Land | Improvement |
|---|---|---|---|---|
| 2025 | $9,084 | $595,700 | $215,400 | $380,300 |
| 2024 | $9,030 | $598,400 | $215,400 | $383,000 |
| 2023 | $8,677 | $554,800 | $215,400 | $339,400 |
| 2022 | $7,950 | $462,500 | $185,400 | $277,100 |
| 2021 | $7,901 | $448,900 | $187,700 | $261,200 |
| 2020 | $7,510 | $432,100 | $185,800 | $246,300 |
| 2019 | $7,331 | $404,800 | $184,000 | $220,800 |
| 2018 | $6,988 | $374,300 | $180,200 | $194,100 |
| 2017 | $6,800 | $372,400 | $178,300 | $194,100 |
| 2016 | $6,635 | $353,300 | $169,500 | $183,800 |
| 2015 | $6,455 | $353,300 | $169,500 | $183,800 |
Source: Public Records
Map
Nearby Homes
- 22 Lakin St
- 10 Lakin St
- 21 Magnolia Ln
- 18 Beech St
- Lot 10 Christian Cir
- 64 Maplewood Dr
- 122 Jewett St
- 120 Townsend St Unit 1
- 120 Townsend St Unit 2
- 2 Blueberry Hill Rd
- 109 Townsend St
- 144 Main St
- 143 Heald St
- 92 Squannacook Rd
- 102 Wheeler St
- 88 Squannacook Rd
- 147 Shirley St
- 6 Mason St Unit 31
- 18 Maple St Unit 14
- Lot 3 Maple Ave