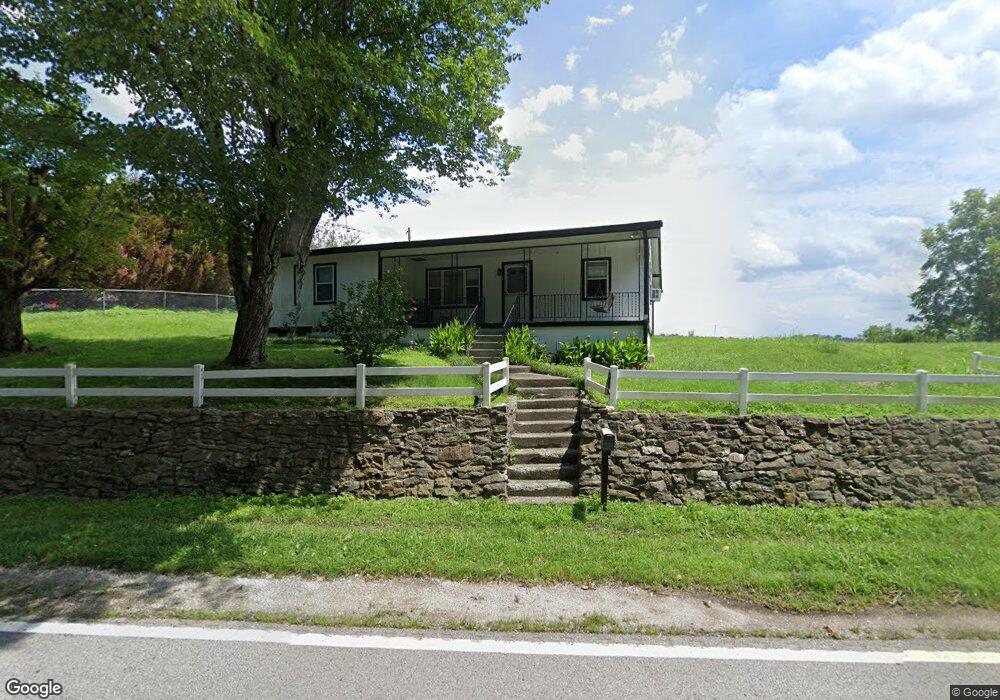
838 York Hwy Gainesboro, TN 38562
Estimated Value: $99,828 - $146,000
2
Beds
1
Bath
1,304
Sq Ft
$87/Sq Ft
Est. Value
About This Home
This home is located at 838 York Hwy, Gainesboro, TN 38562 and is currently estimated at $113,957, approximately $87 per square foot. 838 York Hwy is a home located in Jackson County with nearby schools including Jackson County High School and New Hope Christian Academy.
Ownership History
Date
Name
Owned For
Owner Type
Purchase Details
Closed on
Apr 18, 2018
Sold by
Rich Linda J
Bought by
Estes Mcarthur and Estes David M
Current Estimated Value
Purchase Details
Closed on
Feb 9, 2018
Sold by
Cole Angel Carol
Bought by
Rich Linda J
Purchase Details
Closed on
Feb 1, 2018
Sold by
Estes Regina and Shates Sabrina
Bought by
Rich Linda J
Purchase Details
Closed on
Aug 1, 2006
Sold by
Aline Allen
Bought by
Terry Frye
Home Financials for this Owner
Home Financials are based on the most recent Mortgage that was taken out on this home.
Original Mortgage
$23,000
Interest Rate
6.71%
Purchase Details
Closed on
Feb 25, 1991
Bought by
Allen Eugene and Allen Aline
Purchase Details
Closed on
Jan 4, 1982
Bought by
Allen Eugene and Allen Aline
Purchase Details
Closed on
Jan 2, 1981
Purchase Details
Closed on
Jan 1, 1981
Create a Home Valuation Report for This Property
The Home Valuation Report is an in-depth analysis detailing your home's value as well as a comparison with similar homes in the area
Home Values in the Area
Average Home Value in this Area
Purchase History
| Date | Buyer | Sale Price | Title Company |
|---|---|---|---|
| Estes Mcarthur | $25,000 | None Available | |
| Rich Linda J | $1,500 | None Available | |
| Rich Linda J | -- | None Available | |
| Terry Frye | $43,000 | -- | |
| Allen Eugene | $15,000 | -- | |
| Allen Eugene | -- | -- | |
| -- | $7,000 | -- | |
| -- | $6,500 | -- |
Source: Public Records
Mortgage History
| Date | Status | Borrower | Loan Amount |
|---|---|---|---|
| Previous Owner | Not Available | $23,000 |
Source: Public Records
Tax History Compared to Growth
Tax History
| Year | Tax Paid | Tax Assessment Tax Assessment Total Assessment is a certain percentage of the fair market value that is determined by local assessors to be the total taxable value of land and additions on the property. | Land | Improvement |
|---|---|---|---|---|
| 2024 | $327 | $12,825 | $2,500 | $10,325 |
| 2023 | $327 | $12,825 | $2,500 | $10,325 |
| 2022 | $288 | $12,825 | $2,500 | $10,325 |
| 2021 | $288 | $12,825 | $2,500 | $10,325 |
| 2020 | $285 | $12,825 | $2,500 | $10,325 |
| 2019 | $285 | $10,225 | $2,500 | $7,725 |
| 2018 | $285 | $10,225 | $2,500 | $7,725 |
| 2017 | $285 | $10,225 | $2,500 | $7,725 |
| 2016 | $286 | $10,225 | $2,500 | $7,725 |
| 2015 | $291 | $10,225 | $2,500 | $7,725 |
| 2014 | $296 | $10,400 | $2,500 | $7,900 |
Source: Public Records
Map
Nearby Homes
- 1130 York Hwy Unit 11
- 00 Hurricane Branch Ln
- 0 Hurricane Branch Ln Unit RTC2988788
- 0 Hurrican Branch Rd
- 1385 York Hwy
- 341 Brown Stafford Cemetery Ln
- 1934 York Hwy
- 140 Spivey Ln
- 3473 N Grundy Quarles Hwy
- 160 Enterprise Ln
- 1872 Jennings Creek Hwy
- 11528 Dodson Branch Hwy
- 0 Jennings Creek Hwy Unit 23181050
- 63.26 ac Free State Rd
- 225 Richardson Ln
- 715 N Murray St
- 419 Birch St
- 850 York Hwy
- 857 York Hwy
- 910 York Hwy
- 761 York Hwy
- 131 Charlie Hix Ln
- 727 York Hwy
- 255 Charlie Hix Ln
- 980 York Hwy
- 1005 York Hwy
- 1066 York Hwy
- 1118 York Hwy
- 1095 York Hwy
- 645 Hurricane Branch Ln
- 471 Kirkpatrick Hollow Rd
- 1081 York Hwy
- 1448 York Hwy Unit 14
- 1077 York Hwy Unit 10
- 235 Phillips Hollow Ln
- 455 Hurricane Branch Ln
- 00 Kirkpatrick Hollow Rd