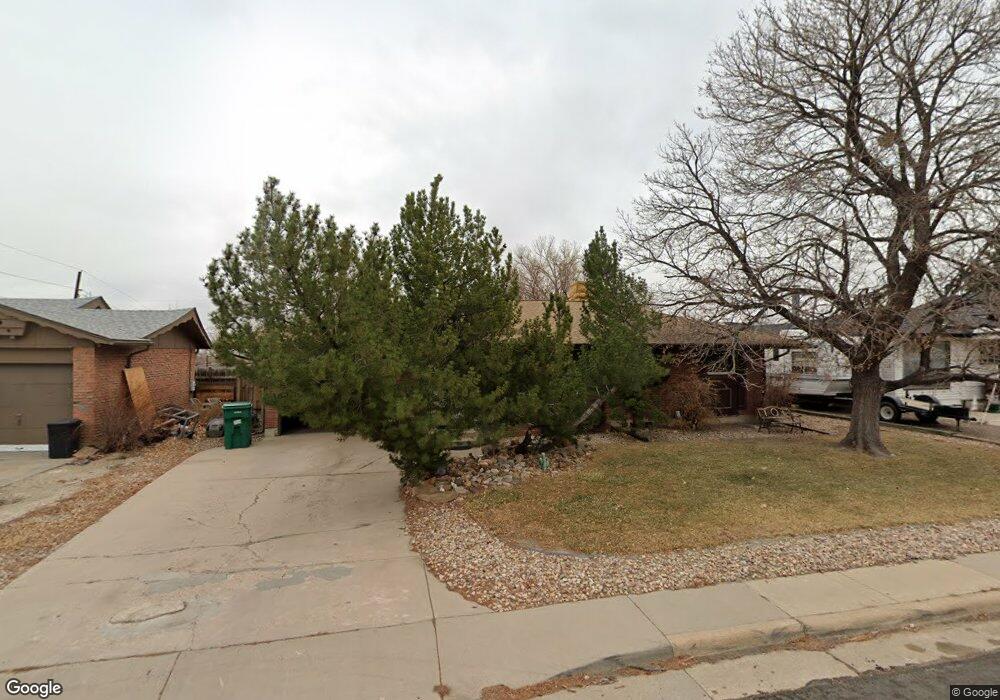
8380 Stacy Dr Denver, CO 80221
Sherrelwood NeighborhoodEstimated Value: $416,000 - $453,000
3
Beds
2
Baths
1,134
Sq Ft
$388/Sq Ft
Est. Value
About This Home
This home is located at 8380 Stacy Dr, Denver, CO 80221 and is currently estimated at $440,031, approximately $388 per square foot. 8380 Stacy Dr is a home located in Adams County with nearby schools including Metropolitan Arts Academy, Iver C. Ranum Middle School, and Westminster High School.
Ownership History
Date
Name
Owned For
Owner Type
Purchase Details
Closed on
Apr 26, 2022
Sold by
Ann Bolton Kimberly
Bought by
Bolton Emily Elizabeth
Current Estimated Value
Purchase Details
Closed on
May 17, 2012
Sold by
Bolton Danny R
Bought by
Bolton Kimberly Ann
Purchase Details
Closed on
Aug 28, 2008
Sold by
Indymac Bank Fsb
Bought by
Woodruff Leon C and Keuhne Nicole L
Home Financials for this Owner
Home Financials are based on the most recent Mortgage that was taken out on this home.
Original Mortgage
$113,223
Interest Rate
6.6%
Mortgage Type
FHA
Purchase Details
Closed on
Aug 1, 1998
Sold by
Bolton Danny R and Bolton Ann Kraft
Bought by
Bolton Danny R and Bolton Kimberly Ann
Home Financials for this Owner
Home Financials are based on the most recent Mortgage that was taken out on this home.
Original Mortgage
$68,700
Interest Rate
6.55%
Purchase Details
Closed on
Oct 30, 1992
Create a Home Valuation Report for This Property
The Home Valuation Report is an in-depth analysis detailing your home's value as well as a comparison with similar homes in the area
Home Values in the Area
Average Home Value in this Area
Purchase History
| Date | Buyer | Sale Price | Title Company |
|---|---|---|---|
| Bolton Emily Elizabeth | -- | None Listed On Document | |
| Bolton Kimberly Ann | -- | None Available | |
| Woodruff Leon C | $115,000 | Chicago Title Co | |
| Bolton Danny R | -- | -- | |
| -- | $70,000 | -- |
Source: Public Records
Mortgage History
| Date | Status | Borrower | Loan Amount |
|---|---|---|---|
| Previous Owner | Woodruff Leon C | $113,223 | |
| Previous Owner | Bolton Danny R | $68,700 |
Source: Public Records
Tax History
| Year | Tax Paid | Tax Assessment Tax Assessment Total Assessment is a certain percentage of the fair market value that is determined by local assessors to be the total taxable value of land and additions on the property. | Land | Improvement |
|---|---|---|---|---|
| 2025 | $3,081 | $29,440 | $5,980 | $23,460 |
| 2024 | $3,081 | $27,060 | $5,500 | $21,560 |
| 2023 | $3,064 | $30,980 | $5,610 | $25,370 |
| 2022 | $2,878 | $24,180 | $5,770 | $18,410 |
| 2021 | $2,944 | $24,180 | $5,770 | $18,410 |
| 2020 | $2,777 | $23,230 | $5,930 | $17,300 |
| 2019 | $2,771 | $23,230 | $5,930 | $17,300 |
| 2018 | $2,119 | $17,670 | $5,400 | $12,270 |
| 2017 | $1,851 | $17,670 | $5,400 | $12,270 |
| 2016 | $1,556 | $14,090 | $2,950 | $11,140 |
| 2015 | $1,555 | $14,090 | $2,950 | $11,140 |
| 2014 | $1,471 | $12,740 | $2,390 | $10,350 |
Source: Public Records
Map
Nearby Homes
- 8371 Shoshone St
- 2141 Stacy Dr
- 1750 Aspen Meadows Cir
- 4817 N Tejon St
- 5095 N Tejon St
- 8227 Vanguard Dr
- 8199 Nola Dr
- 2005 W 86th Ave
- 2055 W 86th Ave
- 8330 Zuni St Unit 207
- 8330 Zuni St Unit 109
- 8330 Zuni St Unit 209
- 8330 Zuni St Unit 105
- 2428 W 82nd Place Unit 3F
- 2430 W 82nd Place Unit 2D
- 1840 Sherrelwood Dr
- 1401 W 85th Ave Unit B302
- 1401 W 85th Ave Unit F201
- 1401 W 85th Ave Unit B405
- 1440 Kokai Cir
- 8390 Stacy Dr
- 8370 Stacy Dr
- 8360 Stacy Dr
- 8373 Stacy Dr
- 8391 Shoshone St
- 8381 Shoshone St
- 8383 Stacy Dr
- 8363 Stacy Dr
- 1920 Stacy Dr
- 8353 Stacy Dr
- 8361 Shoshone St
- 1940 Stacy Dr
- 8372 Tejon St
- 8382 Tejon St
- 8351 Shoshone St
- 1960 Stacy Dr
- 8362 Tejon St
- 8341 Shoshone St
- 8352 Tejon St
- 1834 Aspen Meadows Cir
Your Personal Tour Guide
Ask me questions while you tour the home.