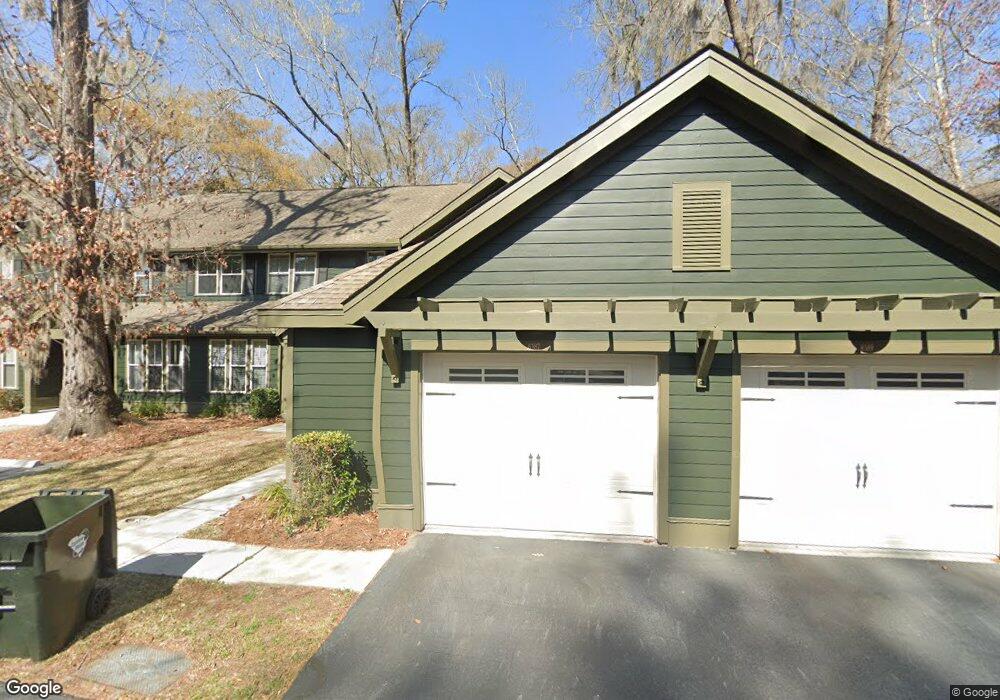
8389 Spring Farm Gate Cir Unit 29D North Charleston, SC 29418
Estimated Value: $286,000 - $353,000
3
Beds
3
Baths
1,790
Sq Ft
$171/Sq Ft
Est. Value
About This Home
This home is located at 8389 Spring Farm Gate Cir Unit 29D, North Charleston, SC 29418 and is currently estimated at $306,626, approximately $171 per square foot. 8389 Spring Farm Gate Cir Unit 29D is a home located in Dorchester County with nearby schools including Eagle Nest Elementary School, River Oaks Middle School, and Fort Dorchester High School.
Ownership History
Date
Name
Owned For
Owner Type
Purchase Details
Closed on
Aug 10, 2022
Sold by
Hoilman Rachel S
Bought by
Bates Margaret Hills
Current Estimated Value
Purchase Details
Closed on
Jul 26, 2019
Sold by
Sabatino Philip A and Sabatino Perette J
Bought by
Hoilman Rachel S and Hoilman Troy W
Home Financials for this Owner
Home Financials are based on the most recent Mortgage that was taken out on this home.
Original Mortgage
$175,500
Interest Rate
3.82%
Mortgage Type
New Conventional
Purchase Details
Closed on
Sep 12, 2008
Sold by
Ashley River Town Homes Llc
Bought by
Sabatino Philip A and Sabatino Perette J
Home Financials for this Owner
Home Financials are based on the most recent Mortgage that was taken out on this home.
Original Mortgage
$182,160
Interest Rate
6.49%
Mortgage Type
Purchase Money Mortgage
Create a Home Valuation Report for This Property
The Home Valuation Report is an in-depth analysis detailing your home's value as well as a comparison with similar homes in the area
Home Values in the Area
Average Home Value in this Area
Purchase History
| Date | Buyer | Sale Price | Title Company |
|---|---|---|---|
| Bates Margaret Hills | $300,000 | Weeks & Irvine Llc | |
| Hoilman Rachel S | $195,000 | None Available | |
| Sabatino Philip A | $230,000 | -- |
Source: Public Records
Mortgage History
| Date | Status | Borrower | Loan Amount |
|---|---|---|---|
| Previous Owner | Hoilman Rachel S | $175,500 | |
| Previous Owner | Sabatino Philip A | $182,160 |
Source: Public Records
Tax History Compared to Growth
Tax History
| Year | Tax Paid | Tax Assessment Tax Assessment Total Assessment is a certain percentage of the fair market value that is determined by local assessors to be the total taxable value of land and additions on the property. | Land | Improvement |
|---|---|---|---|---|
| 2024 | $2,503 | $11,444 | $3,000 | $8,444 |
| 2023 | $2,503 | $7,312 | $1,800 | $5,512 |
| 2022 | $2,012 | $7,670 | $1,800 | $5,870 |
| 2021 | $5,156 | $11,500 | $2,700 | $8,800 |
| 2020 | $5,041 | $191,677 | $0 | $0 |
| 2019 | $4,946 | $189,552 | $0 | $0 |
| 2018 | $4,245 | $9,890 | $1,800 | $8,090 |
| 2017 | $4,179 | $9,890 | $1,800 | $8,090 |
| 2016 | $4,142 | $9,890 | $1,800 | $8,090 |
| 2015 | $4,136 | $9,890 | $1,800 | $8,090 |
| 2014 | -- | $180,600 | $0 | $0 |
Source: Public Records
Map
Nearby Homes
- 5565 Colonial Chatsworth Cir
- 5511 Colonial Chatsworth Cir
- 8318 Child's Cove
- 5437 River Island Ct
- 8250 Longridge Rd
- 5417 Ansley Trail
- 5456 Rising Tide
- 5470 Rising Tide
- 4723 Cotillion Dr
- 4912 Chartwell Dr
- 8301 Wild Indigo Bluff
- 8328 Berringer Bluff
- 5411 Overland Trail
- 3239 Landing Pkwy
- 5540 Indigo Fields Blvd
- 8610 Heatherglen Ct
- 8316 Dye Makers
- 5556 Indigo Fields Blvd
- 125 Remington Dr
- 5505 Indigo Makers Trace
- 8389 Spring Farm Gate Cir
- 8387 Spring Farm Gate Cir
- 8385 Spring Farm Gate Cir Unit 29B
- 8391 Spring Farm Gate Cir
- 8383 Spring Farm Gate Cir
- 8397 Spring Farm Gate Cir
- 8393 Spring Farm Gate Cir
- 8399 Spring Farm Gate Cir Unit 28E
- 8399 Spring Farm Gate Cir
- 8395 Spring Farm Gate Cir
- 8401 Spring Farm Gate Cir
- 8379 Spring Farm Gate Cir
- 8375 Spring Farm Gate Cir
- 8403 Hidden Bakers Trace
- 8405 Hidden Bakers Trace
- 8405 Hidden Baker's Trace Unit 211B
- 8405 Hidden Baker's Trace
- 8390 Camp Gregg Ln
- 8392 Camp Gregg Ln
- 8388 Camp Gregg Ln