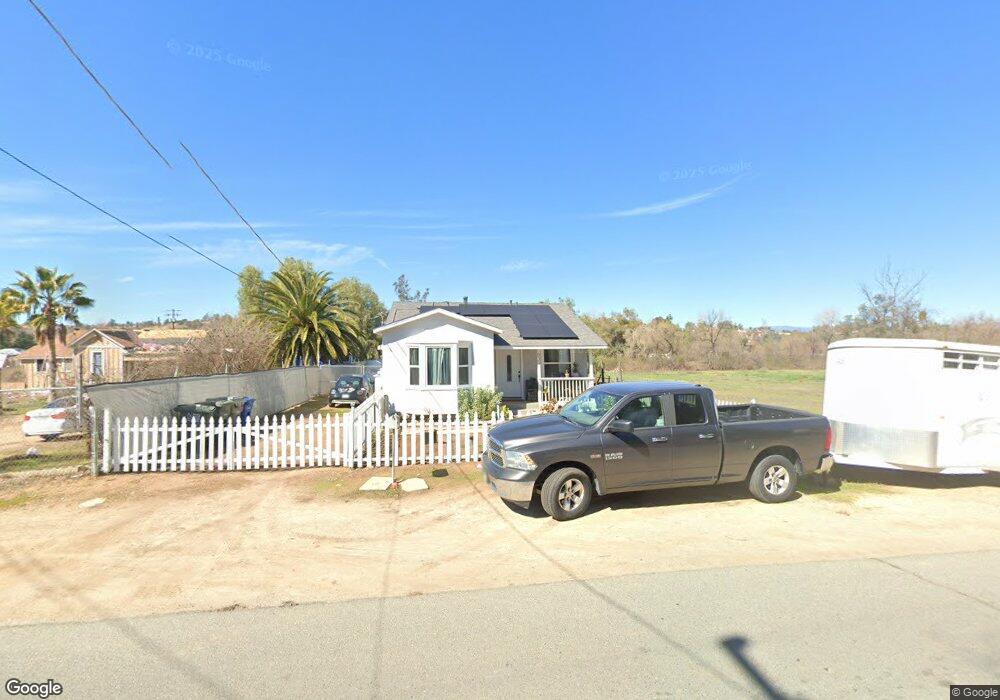
839 A St Ramona, CA 92065
Estimated Value: $433,000 - $594,000
2
Beds
1
Bath
846
Sq Ft
$622/Sq Ft
Est. Value
About This Home
This home is located at 839 A St, Ramona, CA 92065 and is currently estimated at $526,091, approximately $621 per square foot. 839 A St is a home located in San Diego County with nearby schools including Hanson Elementary School, Olive Peirce Middle School, and Ramona High School.
Ownership History
Date
Name
Owned For
Owner Type
Purchase Details
Closed on
Jun 6, 2018
Sold by
Pettross Hildegard
Bought by
Hampton Lisa M
Current Estimated Value
Home Financials for this Owner
Home Financials are based on the most recent Mortgage that was taken out on this home.
Original Mortgage
$358,546
Outstanding Balance
$310,130
Interest Rate
4.6%
Mortgage Type
VA
Estimated Equity
$215,961
Create a Home Valuation Report for This Property
The Home Valuation Report is an in-depth analysis detailing your home's value as well as a comparison with similar homes in the area
Home Values in the Area
Average Home Value in this Area
Purchase History
| Date | Buyer | Sale Price | Title Company |
|---|---|---|---|
| Hampton Lisa M | $351,000 | Ticor Title San Diego Branch |
Source: Public Records
Mortgage History
| Date | Status | Borrower | Loan Amount |
|---|---|---|---|
| Open | Hampton Lisa M | $358,546 |
Source: Public Records
Tax History
| Year | Tax Paid | Tax Assessment Tax Assessment Total Assessment is a certain percentage of the fair market value that is determined by local assessors to be the total taxable value of land and additions on the property. | Land | Improvement |
|---|---|---|---|---|
| 2025 | $4,361 | $399,373 | $295,833 | $103,540 |
| 2024 | $4,361 | $391,543 | $290,033 | $101,510 |
| 2023 | $4,082 | $383,867 | $284,347 | $99,520 |
| 2022 | $4,210 | $376,341 | $278,772 | $97,569 |
| 2021 | $4,142 | $368,962 | $273,306 | $95,656 |
| 2020 | $4,104 | $365,180 | $270,504 | $94,676 |
| 2019 | $4,008 | $358,020 | $265,200 | $92,820 |
| 2018 | $566 | $31,824 | $8,094 | $23,730 |
| 2017 | $559 | $31,201 | $7,936 | $23,265 |
| 2016 | $550 | $30,590 | $7,781 | $22,809 |
| 2015 | $539 | $30,132 | $7,665 | $22,467 |
| 2014 | $532 | $29,542 | $7,515 | $22,027 |
Source: Public Records
Map
Nearby Homes
Your Personal Tour Guide
Ask me questions while you tour the home.