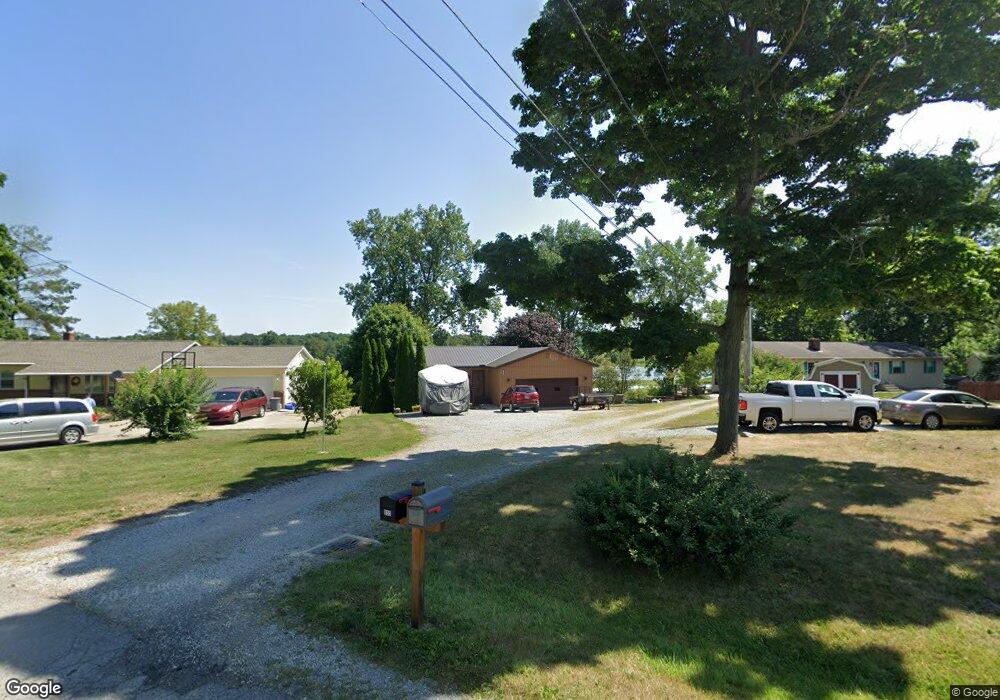
839 Boulevard Rd Ashland, OH 44805
Estimated Value: $193,000 - $233,000
3
Beds
2
Baths
1,196
Sq Ft
$173/Sq Ft
Est. Value
About This Home
This home is located at 839 Boulevard Rd, Ashland, OH 44805 and is currently estimated at $206,750, approximately $172 per square foot. 839 Boulevard Rd is a home located in Ashland County with nearby schools including Crestview Elementary School, Crestview Middle School, and Crestview High School.
Ownership History
Date
Name
Owned For
Owner Type
Purchase Details
Closed on
Oct 8, 2018
Sold by
Spoerr Roger R and Spoerr Christa S
Bought by
Goon John C and Cadwallader Whitney D
Current Estimated Value
Home Financials for this Owner
Home Financials are based on the most recent Mortgage that was taken out on this home.
Original Mortgage
$121,212
Outstanding Balance
$105,704
Interest Rate
4.5%
Mortgage Type
New Conventional
Estimated Equity
$101,046
Purchase Details
Closed on
May 15, 1987
Bought by
Spoerr Roger R
Create a Home Valuation Report for This Property
The Home Valuation Report is an in-depth analysis detailing your home's value as well as a comparison with similar homes in the area
Home Values in the Area
Average Home Value in this Area
Purchase History
| Date | Buyer | Sale Price | Title Company |
|---|---|---|---|
| Goon John C | $120,000 | Nova Title Agency Llc | |
| Spoerr Roger R | $47,500 | -- |
Source: Public Records
Mortgage History
| Date | Status | Borrower | Loan Amount |
|---|---|---|---|
| Open | Goon John C | $121,212 |
Source: Public Records
Tax History Compared to Growth
Tax History
| Year | Tax Paid | Tax Assessment Tax Assessment Total Assessment is a certain percentage of the fair market value that is determined by local assessors to be the total taxable value of land and additions on the property. | Land | Improvement |
|---|---|---|---|---|
| 2024 | $1,754 | $48,170 | $5,530 | $42,640 |
| 2023 | $1,754 | $48,170 | $5,530 | $42,640 |
| 2022 | $1,583 | $37,060 | $4,260 | $32,800 |
| 2021 | $1,584 | $37,060 | $4,260 | $32,800 |
| 2020 | $1,530 | $37,060 | $4,260 | $32,800 |
| 2019 | $1,255 | $29,190 | $4,210 | $24,980 |
| 2018 | $1,302 | $29,190 | $4,210 | $24,980 |
| 2017 | $949 | $29,190 | $4,210 | $24,980 |
| 2016 | $949 | $26,530 | $3,830 | $22,700 |
| 2015 | $983 | $26,530 | $3,830 | $22,700 |
| 2013 | $1,041 | $27,870 | $3,830 | $24,040 |
Source: Public Records
Map
Nearby Homes