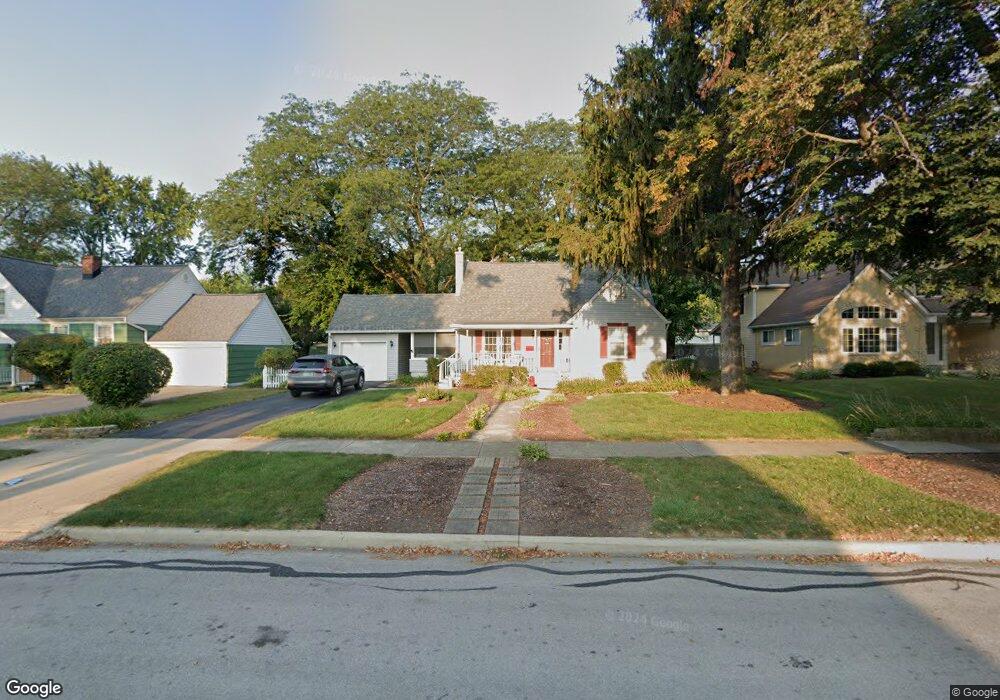
839 N Main St Naperville, IL 60563
North Downtown Naperville NeighborhoodEstimated Value: $468,219 - $643,000
Studio
--
Bath
1,429
Sq Ft
$375/Sq Ft
Est. Value
About This Home
This home is located at 839 N Main St, Naperville, IL 60563 and is currently estimated at $535,805, approximately $374 per square foot. 839 N Main St is a home located in DuPage County with nearby schools including Naper Elementary School, Washington Jr High School, and Naperville North High School.
Ownership History
Date
Name
Owned For
Owner Type
Purchase Details
Closed on
Jun 14, 1995
Sold by
Vickers Clifford J and Vickers Marcella J
Bought by
Williams Robert A and Williams Pamela V
Current Estimated Value
Home Financials for this Owner
Home Financials are based on the most recent Mortgage that was taken out on this home.
Original Mortgage
$121,600
Interest Rate
8.27%
Mortgage Type
Purchase Money Mortgage
Create a Home Valuation Report for This Property
The Home Valuation Report is an in-depth analysis detailing your home's value as well as a comparison with similar homes in the area
Home Values in the Area
Average Home Value in this Area
Purchase History
| Date | Buyer | Sale Price | Title Company |
|---|---|---|---|
| Williams Robert A | $128,000 | -- |
Source: Public Records
Mortgage History
| Date | Status | Borrower | Loan Amount |
|---|---|---|---|
| Closed | Williams Robert A | $121,600 |
Source: Public Records
Tax History
| Year | Tax Paid | Tax Assessment Tax Assessment Total Assessment is a certain percentage of the fair market value that is determined by local assessors to be the total taxable value of land and additions on the property. | Land | Improvement |
|---|---|---|---|---|
| 2024 | $9,683 | $165,889 | $115,953 | $49,936 |
| 2023 | $9,153 | $149,060 | $104,190 | $44,870 |
| 2022 | $8,719 | $140,940 | $98,150 | $42,790 |
| 2021 | $8,410 | $135,910 | $94,650 | $41,260 |
| 2020 | $8,383 | $135,910 | $94,650 | $41,260 |
| 2019 | $8,080 | $129,260 | $90,020 | $39,240 |
| 2018 | $7,768 | $124,670 | $86,500 | $38,170 |
| 2017 | $7,606 | $120,450 | $83,570 | $36,880 |
| 2016 | $7,419 | $115,590 | $80,200 | $35,390 |
| 2015 | $7,425 | $109,750 | $76,150 | $33,600 |
| 2014 | $6,882 | $99,240 | $68,600 | $30,640 |
| 2013 | $6,836 | $99,930 | $69,080 | $30,850 |
Source: Public Records
Map
Nearby Homes
- 905 N Webster St
- 660 N Eagle St
- 1052 N Mill St Unit 111
- 1004 N Mill St Unit 312
- 1004 N Mill St Unit 5302
- 809 N Brainard St
- 1142 N Webster St
- 719 N Brainard St
- 717 N Brainard St
- 715 N Brainard St
- 1104 N Mill St Unit 205
- 1001 N Mill St Unit 203
- 1001 N Mill St Unit 302
- 1105 N Mill St Unit 224
- 837 N Loomis St
- 1041 N Mill St Unit 307
- 1041 N Mill St Unit 203
- 509 N Brainard St
- 1310 Eagle St
- 1314 N Eagle St
- 845 N Main St
- 831 N Main St
- 829 N Main St
- 849 N Main St
- 848 N Webster St
- 836 N Main St
- 854 N Webster St
- 836 N Webster St
- 840 N Main St
- 846 N Webster St
- 830 N Main St
- 846 N Main St
- 856 N Webster St
- 850 N Main St
- 826 N Main St
- 825 N Main St
- 830 N Webster St
- 130 W Ogden Ave
- 860 N Main St
- 824 N Webster St
Your Personal Tour Guide
Ask me questions while you tour the home.