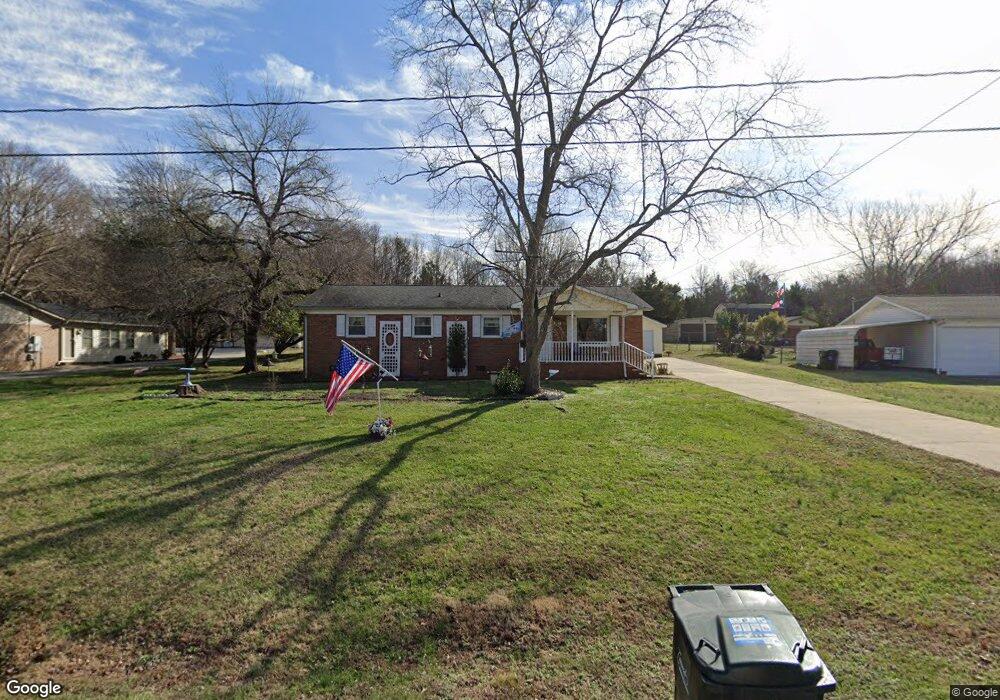
839 Rubens Rd SW Concord, NC 28027
Estimated Value: $276,000 - $353,000
3
Beds
2
Baths
1,933
Sq Ft
$165/Sq Ft
Est. Value
About This Home
This home is located at 839 Rubens Rd SW, Concord, NC 28027 and is currently estimated at $319,014, approximately $165 per square foot. 839 Rubens Rd SW is a home located in Cabarrus County with nearby schools including Wolf Meadow Elementary School, J.N. Fries Middle School, and Branch Christian Academy Concord.
Ownership History
Date
Name
Owned For
Owner Type
Purchase Details
Closed on
Oct 11, 2022
Sold by
Jr Family Trust
Bought by
James Steward Watson Credit Shelter Trust
Current Estimated Value
Purchase Details
Closed on
Dec 28, 2021
Sold by
Watson James S and Watson Ruth H
Bought by
Jr Family Trust
Purchase Details
Closed on
Jan 20, 2017
Sold by
Watson James Steward and Watson Ruth Helmly
Bought by
Watson James Steward and Watson Ruth Helmly
Purchase Details
Closed on
Feb 28, 2012
Sold by
Watson James S and Watson Ruth H
Bought by
Watson James Steward and Watson Ruth Helmly
Purchase Details
Closed on
Oct 13, 2005
Sold by
Household Realty Corp
Bought by
Watson James S and Watson Ruth H
Purchase Details
Closed on
Mar 21, 2005
Sold by
Matheny David and Matheny Jane W
Bought by
Household Realty Corp
Create a Home Valuation Report for This Property
The Home Valuation Report is an in-depth analysis detailing your home's value as well as a comparison with similar homes in the area
Home Values in the Area
Average Home Value in this Area
Purchase History
| Date | Buyer | Sale Price | Title Company |
|---|---|---|---|
| James Steward Watson Credit Shelter Trust | -- | -- | |
| James Steward Watson Credit Shelter Trust | -- | None Listed On Document | |
| Jr Family Trust | -- | Copperline Legal | |
| Watson James Steward | -- | None Available | |
| Watson James Steward | -- | None Available | |
| Watson James S | $94,000 | -- | |
| Household Realty Corp | $110,783 | -- |
Source: Public Records
Tax History Compared to Growth
Tax History
| Year | Tax Paid | Tax Assessment Tax Assessment Total Assessment is a certain percentage of the fair market value that is determined by local assessors to be the total taxable value of land and additions on the property. | Land | Improvement |
|---|---|---|---|---|
| 2025 | $2,515 | $252,550 | $66,000 | $186,550 |
| 2024 | $2,515 | $252,550 | $66,000 | $186,550 |
| 2023 | $1,924 | $157,710 | $38,000 | $119,710 |
| 2022 | $1,924 | $157,710 | $38,000 | $119,710 |
| 2021 | $1,924 | $157,710 | $38,000 | $119,710 |
| 2020 | $1,924 | $157,710 | $38,000 | $119,710 |
| 2019 | $1,569 | $128,640 | $23,000 | $105,640 |
| 2018 | $1,544 | $128,640 | $23,000 | $105,640 |
| 2017 | $1,518 | $128,640 | $23,000 | $105,640 |
| 2016 | $900 | $124,920 | $23,000 | $101,920 |
| 2015 | $1,386 | $124,920 | $23,000 | $101,920 |
| 2014 | $1,386 | $124,920 | $23,000 | $101,920 |
Source: Public Records
Map
Nearby Homes
- 818 Rubens Rd SW
- 1132 Rembrandt Dr SW
- 3294 Shining Rock St SW
- 1239 Kent Downs Ave SW
- 1220 Kent Downs Ave SW
- 3673 Farm Lake Dr SW
- 1398 Kent Downs Ave SW Unit 52
- 1030 Van Gogh Dr SW
- 1022 Van Gogh Dr SW
- 3174 Farmwood Blvd SW Unit 154
- 2694 Woodcrest Dr SW
- 3011 Langhorne Ave SW
- 3133 Roberta Rd
- 4104 Pebblebrook Cir SW
- 3913 Stough Rd
- 4110 Pebblebrook Cir SW
- 1255 Old Charlotte Rd
- 3333 Roberta Rd
- 3369 Roberta Rd
- 668 Jackson Terrace SW
- 838 Rubens Rd SW
- 835 Rubens Rd SW
- 843 Rubens Rd SW
- 842 Rubens Rd SW
- 834 Rubens Rd SW
- 847 Rubens Rd SW
- 831 Rubens Rd SW
- 830 Rubens Rd SW
- 899 Lakeside Dr SW
- 827 Rubens Rd SW
- 826 Rubens Rd SW
- 856 Rubens Rd SW
- 864 Rubens Rd SW
- 903 Lakeside Dr SW
- 823 Rubens Rd SW
- 822 Rubens Rd SW
- 1121 Rembrandt Dr SW
- 1123 Rembrandt Dr SW
- 1117 Rembrandt Dr SW
- 819 Rubens Rd SW