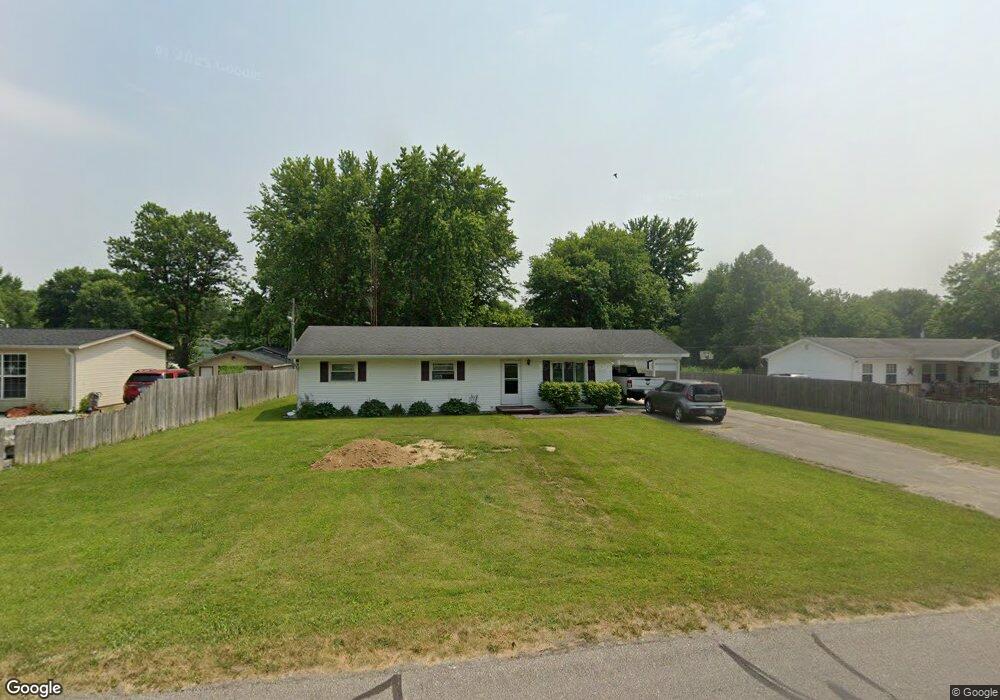
839 Trinton Cir Bedford, IN 47421
Estimated Value: $141,000 - $212,000
4
Beds
2
Baths
1,128
Sq Ft
$154/Sq Ft
Est. Value
About This Home
This home is located at 839 Trinton Cir, Bedford, IN 47421 and is currently estimated at $173,984, approximately $154 per square foot. 839 Trinton Cir is a home located in Lawrence County with nearby schools including Bedford North Lawrence High School.
Ownership History
Date
Name
Owned For
Owner Type
Purchase Details
Closed on
Aug 6, 2010
Sold by
Federal National Mortgage Association
Bought by
Henry Ray
Current Estimated Value
Purchase Details
Closed on
Nov 4, 2009
Sold by
Craig Sheriff Samuel J
Bought by
Federal National Mortgage Association
Purchase Details
Closed on
Feb 27, 2007
Sold by
Fanniemae
Bought by
Prewitt Leahdon M
Purchase Details
Closed on
Jan 9, 2007
Sold by
Samuel Craig Sheriff Of Lawrence C
Bought by
Netbank
Create a Home Valuation Report for This Property
The Home Valuation Report is an in-depth analysis detailing your home's value as well as a comparison with similar homes in the area
Home Values in the Area
Average Home Value in this Area
Purchase History
| Date | Buyer | Sale Price | Title Company |
|---|---|---|---|
| Henry Ray | $28,000 | Statewide Title Company Inc | |
| Federal National Mortgage Association | -- | Feiwell & Hannoy Pc | |
| Federal National Mortgage Association | -- | Feiwell & Hannoy, Pc | |
| Prewitt Leahdon M | $43,000 | -- | |
| Netbank | $82,239 | -- |
Source: Public Records
Tax History Compared to Growth
Tax History
| Year | Tax Paid | Tax Assessment Tax Assessment Total Assessment is a certain percentage of the fair market value that is determined by local assessors to be the total taxable value of land and additions on the property. | Land | Improvement |
|---|---|---|---|---|
| 2024 | $538 | $101,600 | $12,400 | $89,200 |
| 2023 | $479 | $93,300 | $11,600 | $81,700 |
| 2022 | $614 | $91,800 | $11,000 | $80,800 |
| 2021 | $383 | $62,400 | $10,400 | $52,000 |
| 2020 | $375 | $59,900 | $10,500 | $49,400 |
| 2019 | $374 | $58,100 | $10,300 | $47,800 |
| 2018 | $366 | $56,300 | $10,100 | $46,200 |
| 2017 | $367 | $57,600 | $10,000 | $47,600 |
| 2016 | $357 | $56,800 | $9,700 | $47,100 |
| 2014 | $349 | $55,500 | $9,800 | $45,700 |
Source: Public Records
Map
Nearby Homes
- 1949 Sunny Acres Dr
- 4092 Tunnelton Rd
- 5069 Sandpit Rd
- 21 Locksley Ct
- 2403 G St
- 219 Kings Way Ct
- 901 25th St
- 215 Kings Way Ct
- 211 Kings Way Ct
- 0 Tunnelton Rd Unit MBR21859204
- 117 Mill St
- 218 Kings Way Ct
- 214 Kings Way Ct
- 206 Kings Way Ct
- 202 Kings Way Ct
- 1108 25th St
- 222 Kings Way Ct
- 2211 H St
- 301 Nottingham Ct
- 305 Nottingham Ct
- 825 Trinton Cir
- 857 Trinton Cir
- 836 Trinton Cir
- 809 Trinton Cir
- 820 Trinton Cir
- 868 Trinton Cir
- 933 Trinton Cir
- 800 Trinton Cir
- 949 Trinton Cir
- 780 Trinton Cir
- 890 Trinton Cir
- 965 Trinton Cir
- 362 Trinton Cir
- 763 Trinton Cir
- 43 Middle Ave
- 85 Middle Ave
- 764 Trinton Cir
- 115 Middle Ave
- 916 Trinton Cir
- 936 Trinton Cir