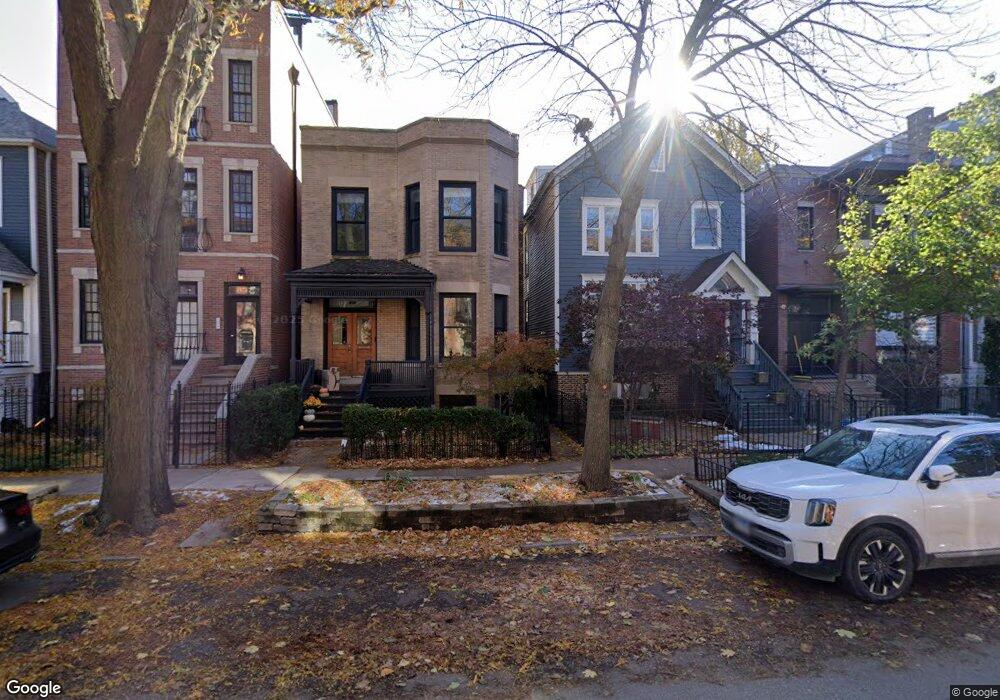
839 W Wrightwood Ave Chicago, IL 60614
Sheffield & DePaul NeighborhoodEstimated Value: $1,455,000 - $1,599,000
4
Beds
5
Baths
2,376
Sq Ft
$636/Sq Ft
Est. Value
About This Home
This home is located at 839 W Wrightwood Ave, Chicago, IL 60614 and is currently estimated at $1,511,421, approximately $636 per square foot. 839 W Wrightwood Ave is a home located in Cook County with nearby schools including Alcott Elementary School, Lincoln Park High School, and Saint Clement School.
Ownership History
Date
Name
Owned For
Owner Type
Purchase Details
Closed on
Feb 18, 2025
Sold by
Johnston Scott Lochwood and Perry Amy Lois
Bought by
Mcgraw Murphy and Mcgraw Francesca
Current Estimated Value
Purchase Details
Closed on
Aug 26, 2021
Sold by
Osborn Russell and Osborn Catherine Gilchrist
Bought by
Johnston Scott Lochwood and Perry Amy Lois
Purchase Details
Closed on
Jul 27, 2012
Sold by
Frick Kathryn K
Bought by
Osborn Russell
Home Financials for this Owner
Home Financials are based on the most recent Mortgage that was taken out on this home.
Original Mortgage
$735,000
Interest Rate
2.75%
Mortgage Type
New Conventional
Purchase Details
Closed on
May 7, 2006
Sold by
Pick Kathy Richland
Bought by
Pick Kathryn R and Kathryn R Pick Revocable Trust
Create a Home Valuation Report for This Property
The Home Valuation Report is an in-depth analysis detailing your home's value as well as a comparison with similar homes in the area
Home Values in the Area
Average Home Value in this Area
Purchase History
| Date | Buyer | Sale Price | Title Company |
|---|---|---|---|
| Mcgraw Murphy | $1,500,000 | Proper Title | |
| Johnston Scott Lochwood | $1,375,000 | Chicago Title | |
| Osborn Russell | -- | Premier Title | |
| Pick Kathryn R | -- | None Available |
Source: Public Records
Mortgage History
| Date | Status | Borrower | Loan Amount |
|---|---|---|---|
| Previous Owner | Osborn Russell | $735,000 |
Source: Public Records
Tax History Compared to Growth
Tax History
| Year | Tax Paid | Tax Assessment Tax Assessment Total Assessment is a certain percentage of the fair market value that is determined by local assessors to be the total taxable value of land and additions on the property. | Land | Improvement |
|---|---|---|---|---|
| 2024 | $24,955 | $139,408 | $58,125 | $81,283 |
| 2023 | $24,327 | $118,274 | $46,875 | $71,399 |
| 2022 | $24,327 | $118,274 | $46,875 | $71,399 |
| 2021 | $23,114 | $118,274 | $46,875 | $71,399 |
| 2020 | $24,095 | $111,264 | $22,500 | $88,764 |
| 2019 | $24,298 | $120,940 | $22,500 | $98,440 |
| 2018 | $23,890 | $120,940 | $22,500 | $98,440 |
| 2017 | $22,078 | $102,562 | $20,000 | $82,562 |
| 2016 | $20,542 | $102,562 | $20,000 | $82,562 |
| 2015 | $18,794 | $102,562 | $20,000 | $82,562 |
| 2014 | $16,435 | $88,581 | $16,875 | $71,706 |
| 2013 | $16,111 | $88,581 | $16,875 | $71,706 |
Source: Public Records
Map
Nearby Homes
- 734 W Wrightwood Ave Unit B
- 2661 N Dayton St
- 886 W Lill Ave Unit 1
- 2719 N Dayton St
- 2653 N Wilton Ave
- 2474 N Orchard St
- 2468 N Orchard St
- 823 W Diversey Pkwy Unit 2
- 2729 N Sheffield Ave Unit 1S
- 908 W Fullerton Ave Unit PH
- 908 W Fullerton Ave Unit 2
- 623 W Drummond Place Unit 6
- 2828 N Burling St Unit 208
- 1014 W Montana St
- 2654 N Lincoln Ave
- 2742 N Kenmore Ave
- 2817 N Orchard St Unit P9
- 820 W Wolfram St Unit F
- 820 W Wolfram St
- 2821 N Orchard St Unit 1
- 837 W Wrightwood Ave Unit 1
- 837 W Wrightwood Ave Unit 2
- 837 W Wrightwood Ave Unit 3
- 841 W Wrightwood Ave
- 841 W Wrightwood Ave Unit A
- 833 W Wrightwood Ave Unit 2
- 843 W Wrightwood Ave
- 831 W Wrightwood Ave Unit 2
- 831 W Wrightwood Ave
- 831 W Wrightwood Ave Unit 1
- 847 W Wrightwood Ave Unit 2
- 829 W Wrightwood Ave Unit 3
- 829 W Wrightwood Ave Unit 1
- 829 W Wrightwood Ave Unit 2
- 829 W Wrightwood Ave Unit 1
- 829 W Wrightwood Ave Unit 2
- 829 W Wrightwood Ave
- 829 W Wrightwood Ave Unit 3
- 849 W Wrightwood Ave Unit 3E
- 849 W Wrightwood Ave Unit 1E