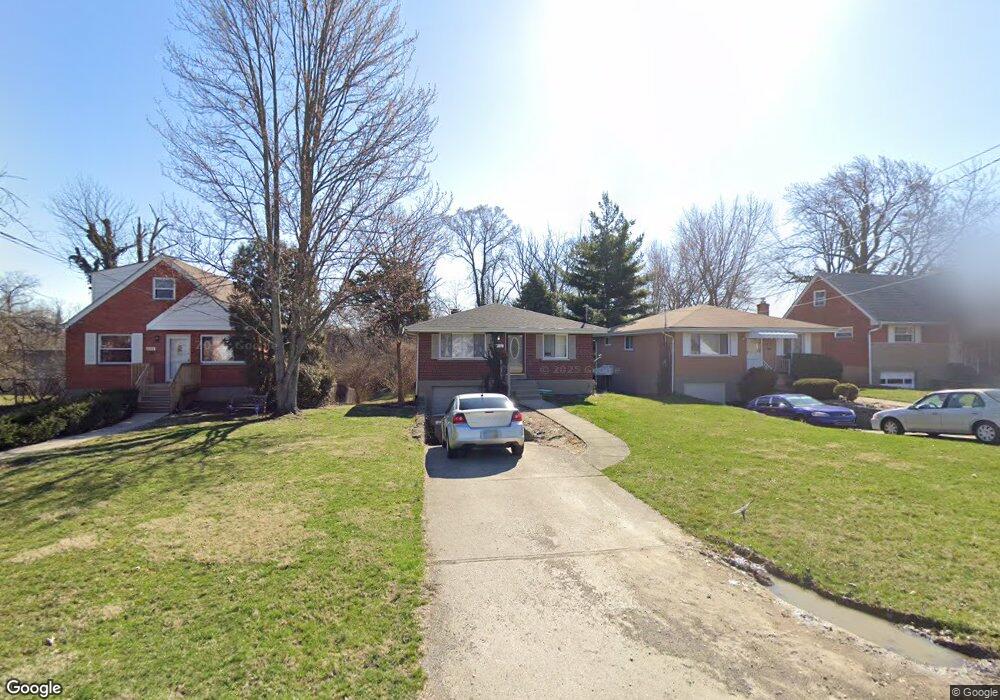
8390 Bobolink Dr Cincinnati, OH 45231
Estimated Value: $178,000 - $230,000
3
Beds
2
Baths
1,312
Sq Ft
$149/Sq Ft
Est. Value
About This Home
This home is located at 8390 Bobolink Dr, Cincinnati, OH 45231 and is currently estimated at $195,106, approximately $148 per square foot. 8390 Bobolink Dr is a home located in Hamilton County with nearby schools including North College Hill Elementary School, North College Hill Middle School, and North College Hill High School.
Ownership History
Date
Name
Owned For
Owner Type
Purchase Details
Closed on
Aug 31, 2015
Sold by
Strong Properties Llc
Bought by
Lowry Shawn A and Lowry Ayanna
Current Estimated Value
Home Financials for this Owner
Home Financials are based on the most recent Mortgage that was taken out on this home.
Original Mortgage
$83,361
Outstanding Balance
$66,225
Interest Rate
4.25%
Mortgage Type
FHA
Estimated Equity
$128,881
Purchase Details
Closed on
Apr 28, 2015
Sold by
Hedges April R
Bought by
Strong Properties Llc
Purchase Details
Closed on
Oct 29, 2004
Sold by
Overton Julene B and Smith Robert J
Bought by
Hedges April R
Home Financials for this Owner
Home Financials are based on the most recent Mortgage that was taken out on this home.
Original Mortgage
$71,900
Interest Rate
6.75%
Mortgage Type
Fannie Mae Freddie Mac
Purchase Details
Closed on
Sep 3, 2004
Sold by
Estate Of Robert J Smith
Bought by
Overton Julene B and Smith Robert J
Home Financials for this Owner
Home Financials are based on the most recent Mortgage that was taken out on this home.
Original Mortgage
$71,900
Interest Rate
6.75%
Mortgage Type
Fannie Mae Freddie Mac
Create a Home Valuation Report for This Property
The Home Valuation Report is an in-depth analysis detailing your home's value as well as a comparison with similar homes in the area
Home Values in the Area
Average Home Value in this Area
Purchase History
| Date | Buyer | Sale Price | Title Company |
|---|---|---|---|
| Lowry Shawn A | $84,900 | Mattingly Ford Title Svcs Ll | |
| Strong Properties Llc | $43,500 | Attorney | |
| Hedges April R | $89,900 | First Assurance Title Agency | |
| Overton Julene B | -- | -- |
Source: Public Records
Mortgage History
| Date | Status | Borrower | Loan Amount |
|---|---|---|---|
| Open | Lowry Shawn A | $83,361 | |
| Previous Owner | Hedges April R | $71,900 |
Source: Public Records
Tax History Compared to Growth
Tax History
| Year | Tax Paid | Tax Assessment Tax Assessment Total Assessment is a certain percentage of the fair market value that is determined by local assessors to be the total taxable value of land and additions on the property. | Land | Improvement |
|---|---|---|---|---|
| 2024 | $2,119 | $41,895 | $6,944 | $34,951 |
| 2023 | $2,138 | $41,895 | $6,944 | $34,951 |
| 2022 | $2,423 | $33,877 | $5,247 | $28,630 |
| 2021 | $2,371 | $33,877 | $5,247 | $28,630 |
| 2020 | $2,080 | $33,877 | $5,247 | $28,630 |
| 2019 | $2,040 | $29,716 | $4,603 | $25,113 |
| 2018 | $2,041 | $29,716 | $4,603 | $25,113 |
| 2017 | $1,929 | $29,716 | $4,603 | $25,113 |
| 2016 | $1,608 | $26,296 | $6,241 | $20,055 |
| 2015 | $1,611 | $26,296 | $6,241 | $20,055 |
| 2014 | $1,610 | $26,296 | $6,241 | $20,055 |
| 2013 | $1,661 | $27,976 | $6,640 | $21,336 |
Source: Public Records
Map
Nearby Homes
- 8579 Daly Rd
- 8543 Foxcroft Dr
- 7929 Cherrywood Ct
- 8681 Desoto Dr
- 7923 Bobolink Dr
- 1280 Brushwood Ave
- 8772 Balboa Dr
- 1478 Foxwood Dr
- 8584 Mockingbird Ln
- 8627 Mockingbird Ln
- 1116 Madeleine Cir
- 1029 Bluejay Dr
- 8840 Grenada Dr
- 6832 Tarawa Dr
- 8622 Mockingbird Ln
- 1025 Eastgate Dr
- 8831 Daly Rd
- 8663 Mockingbird Ln
- 1544 W Galbraith Rd
- 1006 Hearthstone Dr
- 8390 Bobolink Ave
- 8382 Bobolink Ave
- 8382 Bobolink Dr
- 8396 Bobolink Ave
- 8376 Bobolink Ave
- 8370 Bobolink Ave
- 8370 Bobolink Dr
- 8364 Bobolink Ave
- 8364 Bobolink Dr
- 8395 Bobolink Ave
- 8383 Bobolink Ave
- 8395 Bobolink Dr
- 8415 Bobolink Dr
- 8356 Bobolink Ave
- 8377 Bobolink Dr
- 8356 Bobolink Dr
- 8377 Bobolink Ave
- 8401 Bobolink Ave
- 8371 Bobolink Ave
- 8409 Bobolink Dr