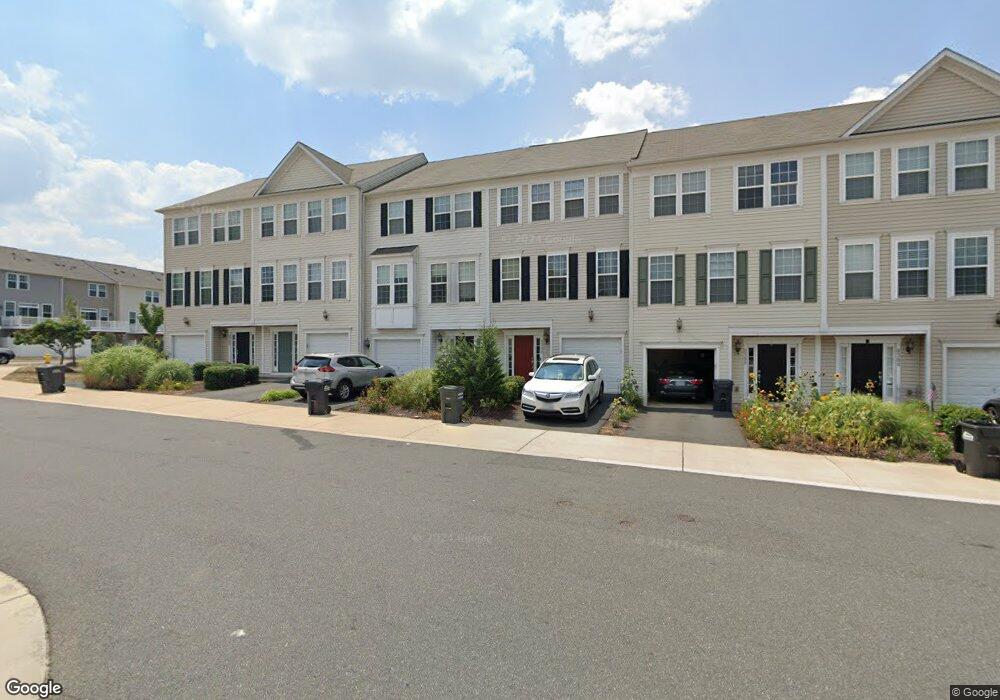
8390 Scotland Loop Manassas, VA 20109
Estimated Value: $500,000 - $533,000
3
Beds
4
Baths
2,062
Sq Ft
$254/Sq Ft
Est. Value
About This Home
This home is located at 8390 Scotland Loop, Manassas, VA 20109 and is currently estimated at $523,025, approximately $253 per square foot. 8390 Scotland Loop is a home located in Prince William County with nearby schools including Loch Lomond Elementary School, Parkside Middle School, and Osbourn Park High School.
Ownership History
Date
Name
Owned For
Owner Type
Purchase Details
Closed on
Jun 6, 2019
Sold by
Roman Samuel Ayala and Medrano Ruth D
Bought by
Smulyan Jeff and Haldrup Lotte
Current Estimated Value
Home Financials for this Owner
Home Financials are based on the most recent Mortgage that was taken out on this home.
Original Mortgage
$272,000
Outstanding Balance
$239,634
Interest Rate
4.2%
Mortgage Type
New Conventional
Estimated Equity
$283,391
Purchase Details
Closed on
Oct 7, 2015
Sold by
Anthony Michael
Bought by
Roman Samuel Ayala and Medrano Ruth D
Home Financials for this Owner
Home Financials are based on the most recent Mortgage that was taken out on this home.
Original Mortgage
$294,566
Interest Rate
3.75%
Mortgage Type
FHA
Purchase Details
Closed on
Dec 18, 2013
Sold by
Neighborhoods Iv Llc
Bought by
Anthony Michael
Home Financials for this Owner
Home Financials are based on the most recent Mortgage that was taken out on this home.
Original Mortgage
$297,992
Interest Rate
3.87%
Mortgage Type
FHA
Create a Home Valuation Report for This Property
The Home Valuation Report is an in-depth analysis detailing your home's value as well as a comparison with similar homes in the area
Home Values in the Area
Average Home Value in this Area
Purchase History
| Date | Buyer | Sale Price | Title Company |
|---|---|---|---|
| Smulyan Jeff | $347,500 | Attorney | |
| Roman Samuel Ayala | $300,000 | None Available | |
| Anthony Michael | $303,490 | -- |
Source: Public Records
Mortgage History
| Date | Status | Borrower | Loan Amount |
|---|---|---|---|
| Open | Smulyan Jeff | $272,000 | |
| Previous Owner | Roman Samuel Ayala | $294,566 | |
| Previous Owner | Anthony Michael | $297,992 |
Source: Public Records
Tax History Compared to Growth
Tax History
| Year | Tax Paid | Tax Assessment Tax Assessment Total Assessment is a certain percentage of the fair market value that is determined by local assessors to be the total taxable value of land and additions on the property. | Land | Improvement |
|---|---|---|---|---|
| 2025 | $2,726 | $467,500 | $108,000 | $359,500 |
| 2024 | $2,726 | $435,600 | $102,400 | $333,200 |
| 2023 | $4,204 | $404,000 | $89,000 | $315,000 |
| 2022 | $4,146 | $374,400 | $85,500 | $288,900 |
| 2021 | $4,220 | $346,000 | $85,500 | $260,500 |
| 2020 | $5,047 | $325,600 | $85,500 | $240,100 |
| 2019 | $4,676 | $301,700 | $76,900 | $224,800 |
| 2018 | $3,475 | $287,800 | $76,900 | $210,900 |
| 2017 | $3,547 | $287,600 | $76,900 | $210,700 |
| 2016 | $3,524 | $288,500 | $76,900 | $211,600 |
| 2015 | $3,229 | $271,900 | $75,000 | $196,900 |
| 2014 | $3,229 | $258,200 | $75,000 | $183,200 |
Source: Public Records
Map
Nearby Homes
- 9920 Whitemoss Dr
- 8429 Girvan Ct
- 8393 Scotland Loop
- 8555 Fortrose Dr
- 8355 Irongate Way
- 8323 Rolling Rd
- 9902 Grapewood Ct
- 8513 Thomas Dr
- 8720 Sugarwood Ln Unit 1
- 10014 Willow Grove Trail
- 8329 Georgian Ct
- 8317 Georgian Ct
- 8431 Georgian Ct
- 8827 Oak Hollow Ct
- 9405 Blackstone Rd
- 8657 Braxted Ln
- 8333 Gaither St
- 8341 Tillett Loop
- 9929 Loudoun Ave
- Matisse Plan at Lomond Village - Condos
- 8390 Scotland Loop Unit 3
- 8392 Scotland Loop
- 8392 Scotland Loop Unit 2
- 8388 Scotland Loop
- 8388 Scotland Loop Unit 4
- 8384 Scotland Loop
- 8391 Scotland Loop
- 8382 Scotland Loop
- 8382 Scotland Loop Unit 7
- 8380 Scotland Loop
- 8393 Scotland Loop Unit 72
- 8389 Scotland Loop
- 8387 Scotland Loop
- 8385 Scotland Loop
- 8385 Scotland Loop Unit 68
- 8374 Scotland Loop
- 8372 Scotland Loop
- 8383 Scotland Loop
- 8370 Scotland Loop Unit 11
- 8370 Scotland Loop