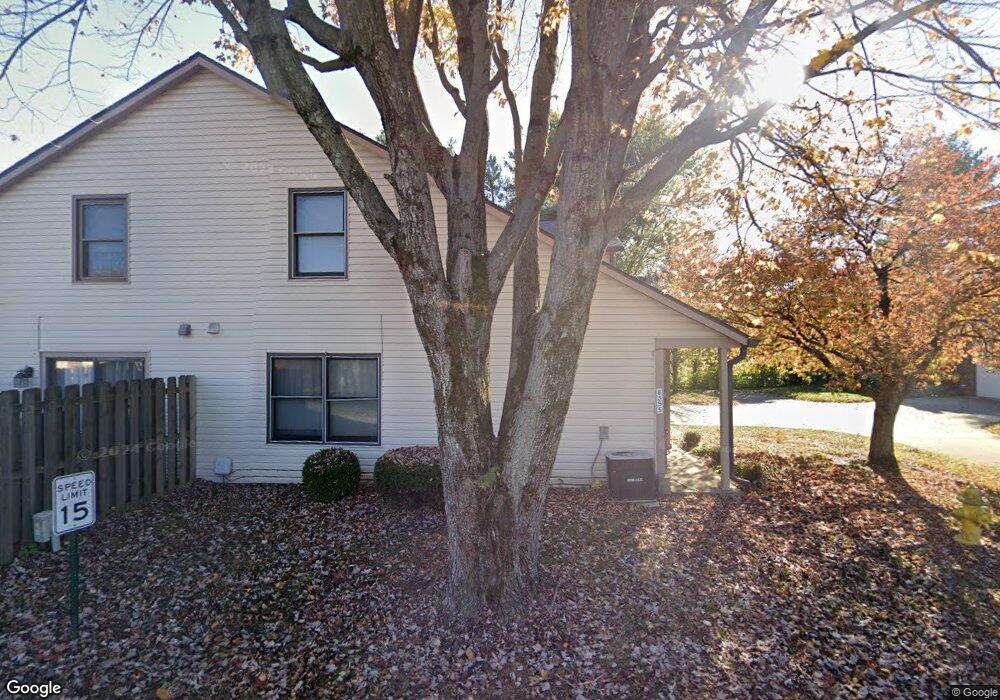
8393 Chapel Pines Dr Unit 19 Indianapolis, IN 46234
Chapel Hill-Ben Davis NeighborhoodEstimated Value: $166,929 - $189,000
2
Beds
2
Baths
1,225
Sq Ft
$142/Sq Ft
Est. Value
About This Home
This home is located at 8393 Chapel Pines Dr Unit 19, Indianapolis, IN 46234 and is currently estimated at $174,232, approximately $142 per square foot. 8393 Chapel Pines Dr Unit 19 is a home located in Marion County with nearby schools including Chapel Glen Elementary School, Chapel Hill 7th & 8th Grade Center, and Ben Davis High School.
Ownership History
Date
Name
Owned For
Owner Type
Purchase Details
Closed on
Jun 27, 2025
Sold by
Revocable Living Trust Of Lynn A Funk An and Funk Lynn A
Bought by
Buzz Investment Group Llc
Current Estimated Value
Purchase Details
Closed on
May 10, 2014
Sold by
Funk Vicky L
Bought by
Funk Lynn A and Funk Vicky L
Purchase Details
Closed on
Oct 22, 2013
Sold by
Alexander Courtney
Bought by
Funk Vicky L
Purchase Details
Closed on
May 19, 2013
Sold by
Bank Of America Na Successor By Merger To Bac
Bought by
Secretary Of Housing And Urban Development
Purchase Details
Closed on
Apr 15, 2013
Sold by
Sheriff John Layton
Bought by
Bank Of America Na
Purchase Details
Closed on
Aug 31, 2005
Sold by
Correll Carrie B and Bancroft Carrie S
Bought by
Gray Kari
Home Financials for this Owner
Home Financials are based on the most recent Mortgage that was taken out on this home.
Original Mortgage
$84,945
Interest Rate
6.01%
Mortgage Type
FHA
Create a Home Valuation Report for This Property
The Home Valuation Report is an in-depth analysis detailing your home's value as well as a comparison with similar homes in the area
Home Values in the Area
Average Home Value in this Area
Purchase History
| Date | Buyer | Sale Price | Title Company |
|---|---|---|---|
| Buzz Investment Group Llc | -- | None Listed On Document | |
| Funk Lynn A | -- | None Available | |
| Funk Vicky L | $38,800 | -- | |
| Secretary Of Housing And Urban Development | $42,600 | -- | |
| Bank Of America Na | $42,600 | -- | |
| Gray Kari | -- | None Available |
Source: Public Records
Mortgage History
| Date | Status | Borrower | Loan Amount |
|---|---|---|---|
| Previous Owner | Gray Kari | $84,945 |
Source: Public Records
Tax History Compared to Growth
Tax History
| Year | Tax Paid | Tax Assessment Tax Assessment Total Assessment is a certain percentage of the fair market value that is determined by local assessors to be the total taxable value of land and additions on the property. | Land | Improvement |
|---|---|---|---|---|
| 2024 | $3,178 | $158,600 | $18,400 | $140,200 |
| 2023 | $3,178 | $132,300 | $18,400 | $113,900 |
| 2022 | $2,973 | $123,600 | $18,400 | $105,200 |
| 2021 | $2,869 | $103,800 | $18,400 | $85,400 |
| 2020 | $2,766 | $100,000 | $18,400 | $81,600 |
| 2019 | $2,459 | $88,700 | $18,400 | $70,300 |
| 2018 | $1,988 | $81,900 | $18,400 | $63,500 |
| 2017 | $1,869 | $76,900 | $18,400 | $58,500 |
| 2016 | $1,941 | $80,000 | $18,400 | $61,600 |
| 2014 | $685 | $74,500 | $18,400 | $56,100 |
| 2013 | $687 | $77,600 | $18,400 | $59,200 |
Source: Public Records
Map
Nearby Homes
- 8409 Chapel Pines Dr
- 8539 Chapel Pines Dr
- 821 Chapel Pines Dr W
- 918 Ardsley Dr
- 839 Fernwood Ct
- 810 Kendale Ct
- 390 Nottinghill Ct
- 8729 Chapel Glen Dr
- 1210 Country Creek Ct
- 8840 Ellington Dr
- 1255 Country Ridge Ln
- 8443 Nottinghill Dr
- 1357 Country Ridge Ln
- 9230 W 10th St
- 718 Bradford Cir
- 7506 Radburn Cir
- 9218 Wind River Ct Unit 4155
- 263 N Raceway Rd
- 535 Radburn Dr
- 8434 Country Meadows Dr
- 8391 Chapel Pines Dr
- 8391 Chapel Pines Dr Unit 17
- 8393 Chapel Pines Dr
- 8389 Chapel Pines Dr
- 8389 Chapel Pines Dr Unit 18
- 8395 Chapel Pines Dr
- 8395 Chapel Pines Dr Unit 20
- 8377 Chapel Pines Dr
- 8379 Chapel Pines Dr
- 8379 Chapel Pines Dr Unit 16
- 8375 Chapel Pines Dr
- 8411 Chapel Pines Dr
- 8411 Chapel Pines Dr Unit 22
- 8373 Chapel Pines Dr
- 8420 Warrington Dr
- 8415 Chapel Pines Dr
- 8415 Chapel Pines Dr Unit 23
- 8413 Chapel Pines Dr
- 8413 Chapel Pines Dr Unit 24
- 795 Staton Place West Dr