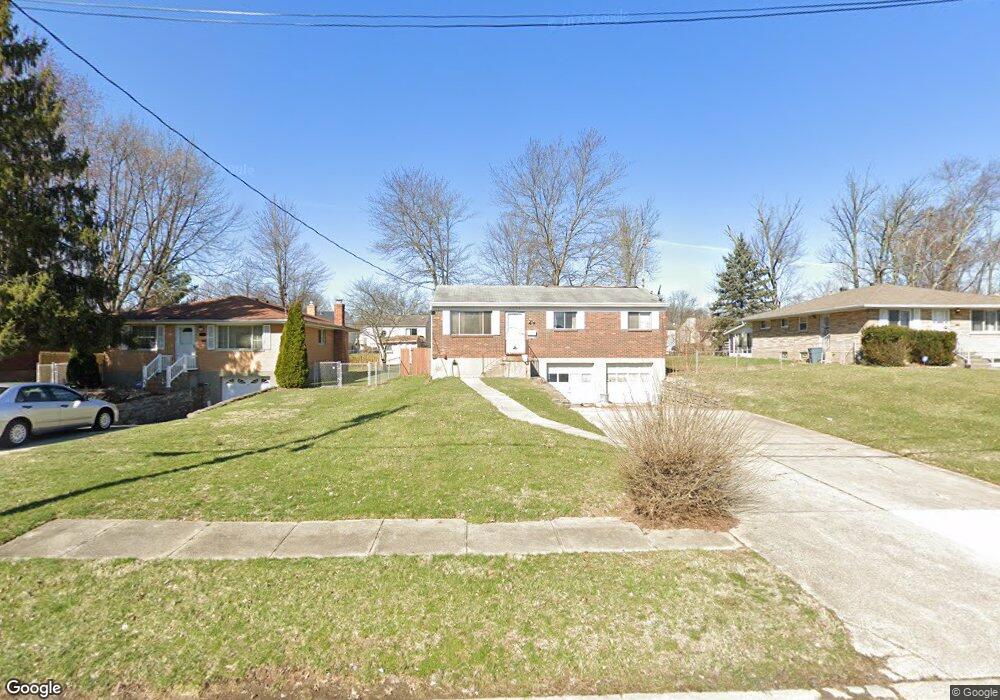
8395 Bobolink Ave Cincinnati, OH 45231
Estimated Value: $203,000 - $214,000
3
Beds
2
Baths
936
Sq Ft
$222/Sq Ft
Est. Value
About This Home
This home is located at 8395 Bobolink Ave, Cincinnati, OH 45231 and is currently estimated at $207,823, approximately $222 per square foot. 8395 Bobolink Ave is a home located in Hamilton County with nearby schools including North College Hill Elementary School, North College Hill Middle School, and North College Hill High School.
Ownership History
Date
Name
Owned For
Owner Type
Purchase Details
Closed on
Nov 12, 2019
Sold by
Dream Developers Llc
Bought by
Anderson Damian Rayshawn
Current Estimated Value
Home Financials for this Owner
Home Financials are based on the most recent Mortgage that was taken out on this home.
Original Mortgage
$136,482
Outstanding Balance
$119,828
Interest Rate
3.5%
Mortgage Type
FHA
Estimated Equity
$87,995
Purchase Details
Closed on
Jul 25, 2019
Sold by
Neil Jim
Bought by
Dream Developers Llc
Create a Home Valuation Report for This Property
The Home Valuation Report is an in-depth analysis detailing your home's value as well as a comparison with similar homes in the area
Home Values in the Area
Average Home Value in this Area
Purchase History
| Date | Buyer | Sale Price | Title Company |
|---|---|---|---|
| Anderson Damian Rayshawn | $139,000 | Ltoc | |
| Dream Developers Llc | $46,200 | None Available |
Source: Public Records
Mortgage History
| Date | Status | Borrower | Loan Amount |
|---|---|---|---|
| Open | Anderson Damian Rayshawn | $136,482 |
Source: Public Records
Tax History Compared to Growth
Tax History
| Year | Tax Paid | Tax Assessment Tax Assessment Total Assessment is a certain percentage of the fair market value that is determined by local assessors to be the total taxable value of land and additions on the property. | Land | Improvement |
|---|---|---|---|---|
| 2024 | $2,942 | $58,156 | $5,474 | $52,682 |
| 2023 | $2,968 | $58,156 | $5,474 | $52,682 |
| 2022 | $3,479 | $48,650 | $4,137 | $44,513 |
| 2021 | $3,405 | $48,650 | $4,137 | $44,513 |
| 2020 | $2,987 | $48,650 | $4,137 | $44,513 |
| 2019 | $1,890 | $24,112 | $3,630 | $20,482 |
| 2018 | $2,328 | $24,112 | $3,630 | $20,482 |
| 2017 | $984 | $24,112 | $3,630 | $20,482 |
| 2016 | $1,044 | $26,156 | $4,921 | $21,235 |
| 2015 | $1,055 | $26,156 | $4,921 | $21,235 |
| 2014 | $1,055 | $26,156 | $4,921 | $21,235 |
| 2013 | $1,123 | $27,825 | $5,236 | $22,589 |
Source: Public Records
Map
Nearby Homes
- 8579 Daly Rd
- 8543 Foxcroft Dr
- 7929 Cherrywood Ct
- 8681 Desoto Dr
- 7923 Bobolink Dr
- 1280 Brushwood Ave
- 8772 Balboa Dr
- 1478 Foxwood Dr
- 8584 Mockingbird Ln
- 8627 Mockingbird Ln
- 1116 Madeleine Cir
- 1029 Bluejay Dr
- 8840 Grenada Dr
- 6832 Tarawa Dr
- 8622 Mockingbird Ln
- 1025 Eastgate Dr
- 8831 Daly Rd
- 8663 Mockingbird Ln
- 1544 W Galbraith Rd
- 1006 Hearthstone Dr
- 8395 Bobolink Dr
- 8383 Bobolink Ave
- 8401 Bobolink Ave
- 8377 Bobolink Ave
- 8377 Bobolink Dr
- 8409 Bobolink Dr
- 8409 Bobolink Ave
- 8371 Bobolink Ave
- 8390 Carrol Ave
- 8390 Carrol Ave Unit 111
- 8396 Carrol Ave
- 8396 Carrol Ave Unit 110
- 8415 Bobolink Ave
- 8382 Carrol Ave
- 8382 Carrol Ave Unit 112
- 8400 Carrol Ave
- 8400 Carrol Ave Unit 109
- 8415 Bobolink Dr
- 8376 Carrol Ave
- 8376 Carrol Ave Unit 113