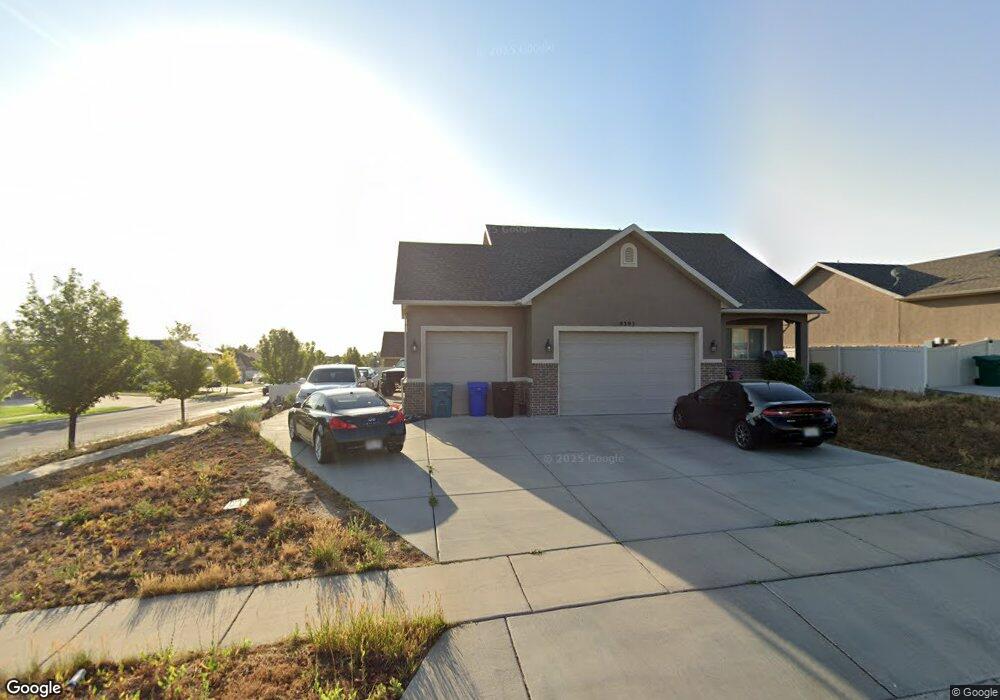
8397 S Delicate Arch Dr West Jordan, UT 84081
Jordan Hills NeighborhoodEstimated Value: $588,000 - $641,000
3
Beds
3
Baths
1,740
Sq Ft
$357/Sq Ft
Est. Value
About This Home
This home is located at 8397 S Delicate Arch Dr, West Jordan, UT 84081 and is currently estimated at $621,471, approximately $357 per square foot. 8397 S Delicate Arch Dr is a home located in Salt Lake County with nearby schools including Oakcrest Elementary School, Sunset Ridge Middle School, and Copper Hills High School.
Ownership History
Date
Name
Owned For
Owner Type
Purchase Details
Closed on
Apr 24, 2017
Sold by
Martinez Chad and Gage Carrie A
Bought by
Martinez Chad M and Gage Carrie A
Current Estimated Value
Home Financials for this Owner
Home Financials are based on the most recent Mortgage that was taken out on this home.
Original Mortgage
$256,500
Outstanding Balance
$213,970
Interest Rate
4.3%
Mortgage Type
New Conventional
Estimated Equity
$407,501
Purchase Details
Closed on
Jun 28, 2010
Sold by
Dakota Homes Inc
Bought by
Martinez Chad M and Gage Carrie A
Home Financials for this Owner
Home Financials are based on the most recent Mortgage that was taken out on this home.
Original Mortgage
$241,364
Interest Rate
4.75%
Mortgage Type
FHA
Purchase Details
Closed on
Apr 7, 2010
Sold by
Discovery Hills Inc
Bought by
Dakota Homes Inc
Home Financials for this Owner
Home Financials are based on the most recent Mortgage that was taken out on this home.
Original Mortgage
$124,800
Interest Rate
5.01%
Mortgage Type
Purchase Money Mortgage
Create a Home Valuation Report for This Property
The Home Valuation Report is an in-depth analysis detailing your home's value as well as a comparison with similar homes in the area
Home Values in the Area
Average Home Value in this Area
Purchase History
| Date | Buyer | Sale Price | Title Company |
|---|---|---|---|
| Martinez Chad M | -- | Metro National Title | |
| Martinez Chad M | -- | Meridian Title | |
| Dakota Homes Inc | -- | Meridian Title |
Source: Public Records
Mortgage History
| Date | Status | Borrower | Loan Amount |
|---|---|---|---|
| Open | Martinez Chad M | $256,500 | |
| Closed | Martinez Chad M | $241,364 | |
| Previous Owner | Dakota Homes Inc | $124,800 |
Source: Public Records
Tax History Compared to Growth
Tax History
| Year | Tax Paid | Tax Assessment Tax Assessment Total Assessment is a certain percentage of the fair market value that is determined by local assessors to be the total taxable value of land and additions on the property. | Land | Improvement |
|---|---|---|---|---|
| 2025 | $2,967 | $588,300 | $173,100 | $415,200 |
| 2024 | $2,967 | $570,900 | $168,000 | $402,900 |
| 2023 | $3,012 | $546,200 | $161,600 | $384,600 |
| 2022 | $3,122 | $556,900 | $158,400 | $398,500 |
| 2021 | $2,620 | $425,500 | $124,700 | $300,800 |
| 2020 | $2,405 | $366,500 | $124,700 | $241,800 |
| 2019 | $2,410 | $360,200 | $124,700 | $235,500 |
| 2018 | $2,281 | $338,100 | $122,800 | $215,300 |
| 2017 | $2,143 | $316,300 | $122,800 | $193,500 |
| 2016 | $2,113 | $293,000 | $119,800 | $173,200 |
| 2015 | $2,138 | $289,000 | $122,000 | $167,000 |
| 2014 | $1,945 | $258,900 | $110,600 | $148,300 |
Source: Public Records
Map
Nearby Homes
- 8404 S Snow Canyon Dr
- 8494 S Otter Creek Dr
- 7049 W Jacobs Park Ln
- Kingsburg Plan at Pierson Farms
- Fairfax Plan at Pierson Farms
- Cordova Plan at Pierson Farms
- Maybrooke Plan at Pierson Farms
- Cameron Plan at Pierson Farms
- 7092 W Jayson Bend Dr
- 8404 S Ivy Springs Ln
- 8457 Ivy Springs Ln
- 7171 W 8170 S
- 6647 W Merlot Way
- 6626 Yellow Poppy Dr
- 6784 W 8070 S
- 8169 S Flaxton Ln
- 7622 Iron Canyon Unit 343
- 7628 S Clipper Hill Rd W Unit 303
- 7647 S Clipper Hill Rd W Unit 338
- 7068 W Terrain Rd Unit 163
- 8413 S Delicate Arch Dr
- 8413 S Delicate Arch Dr
- 8394 S Snow Canyon Dr
- 8394 S Snow Canyon Dr
- 8423 S Delicate Arch Dr
- 6951 W Otter Creek Dr Unit 3
- 6951 W Otter Creek Dr Unit 1
- 6951 W Otter Creek Dr Unit 2
- 6951 W Otter Creek Dr
- 8423 S Delicate Arch Dr
- 6922 W Otter Creek Dr Unit 2022
- 8422 S Snow Canyon Dr
- 6938 W Otter Creek Dr Unit 2021
- 8422 S Snow Canyon Dr
- 8414 S Delicate Arch Dr
- 8414 S Delicate Arch Dr
- 6914 W Otter Creek Dr Unit 2023
- 6914 W Otter Creek Dr
- 6963 W Otter Creek Dr
- 6952 W Otter Creek Dr Unit 2020