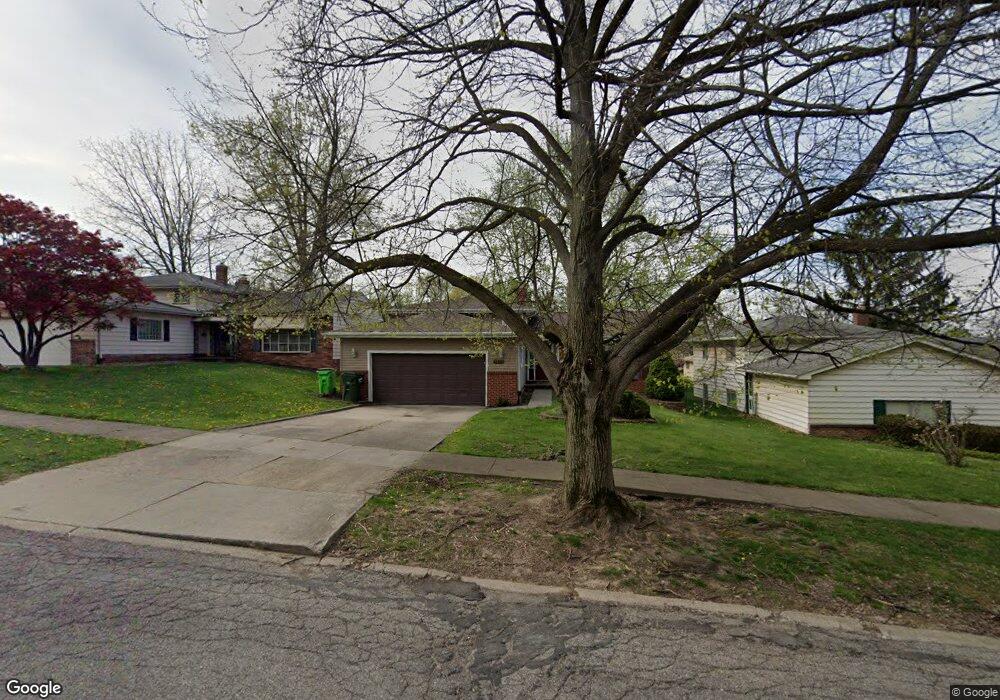
8398 Care Dr Cleveland, OH 44125
Estimated Value: $195,000 - $248,000
3
Beds
2
Baths
2,160
Sq Ft
$98/Sq Ft
Est. Value
About This Home
This home is located at 8398 Care Dr, Cleveland, OH 44125 and is currently estimated at $212,306, approximately $98 per square foot. 8398 Care Dr is a home located in Cuyahoga County with nearby schools including Garfield Heights High School, North Shore High School, and Holy Name Elementary School.
Ownership History
Date
Name
Owned For
Owner Type
Purchase Details
Closed on
Apr 3, 2011
Sold by
Raisden James and Baisden Colin
Bought by
Workman Monica R
Current Estimated Value
Home Financials for this Owner
Home Financials are based on the most recent Mortgage that was taken out on this home.
Original Mortgage
$112,365
Outstanding Balance
$78,386
Interest Rate
5.04%
Mortgage Type
VA
Estimated Equity
$133,920
Purchase Details
Closed on
Dec 7, 2009
Sold by
Deutsche Bank National Trust Company
Bought by
Baisden James and Baisden Colin
Purchase Details
Closed on
Jun 15, 2009
Sold by
Smith Janet A and Smith Jimmie
Bought by
Deutsche Bank National Trust Company
Purchase Details
Closed on
Jul 27, 1982
Sold by
Frances A Godlesski
Bought by
Smith Janet A
Purchase Details
Closed on
May 8, 1979
Sold by
Godlewski Edward J and Godlewski Frances
Bought by
Frances A Godlesski
Purchase Details
Closed on
Jan 1, 1975
Bought by
Godlewski Edward J and Godlewski Frances
Create a Home Valuation Report for This Property
The Home Valuation Report is an in-depth analysis detailing your home's value as well as a comparison with similar homes in the area
Home Values in the Area
Average Home Value in this Area
Purchase History
| Date | Buyer | Sale Price | Title Company |
|---|---|---|---|
| Workman Monica R | $110,000 | Equity Title Agency | |
| Baisden James | $56,000 | Platinum Title Services | |
| Deutsche Bank National Trust Company | $70,200 | None Available | |
| Smith Janet A | -- | -- | |
| Frances A Godlesski | -- | -- | |
| Godlewski Edward J | -- | -- |
Source: Public Records
Mortgage History
| Date | Status | Borrower | Loan Amount |
|---|---|---|---|
| Open | Workman Monica R | $112,365 |
Source: Public Records
Tax History Compared to Growth
Tax History
| Year | Tax Paid | Tax Assessment Tax Assessment Total Assessment is a certain percentage of the fair market value that is determined by local assessors to be the total taxable value of land and additions on the property. | Land | Improvement |
|---|---|---|---|---|
| 2024 | $6,506 | $64,995 | $9,940 | $55,055 |
| 2023 | $4,549 | $41,580 | $8,155 | $33,425 |
| 2022 | $4,484 | $41,580 | $8,155 | $33,425 |
| 2021 | $4,742 | $41,580 | $8,160 | $33,430 |
| 2020 | $4,503 | $37,140 | $7,280 | $29,860 |
| 2019 | $4,461 | $106,100 | $20,800 | $85,300 |
| 2018 | $4,086 | $37,140 | $7,280 | $29,860 |
| 2017 | $3,697 | $28,430 | $5,220 | $23,210 |
| 2016 | $3,751 | $28,430 | $5,220 | $23,210 |
| 2015 | $4,131 | $28,430 | $5,220 | $23,210 |
| 2014 | $4,131 | $34,650 | $6,370 | $28,280 |
Source: Public Records
Map
Nearby Homes
- 5074 Donovan Dr
- 8531 Cherie Dr
- 4928 E 84th St
- 8827 Park Heights Ave
- 9011 Park Heights Ave
- 4963 E 88th St
- 4909 E 85th St
- 4977 E 90th St
- 9302 Park Heights Ave
- 4888 E 85th St
- 4915 E 88th St
- 4932 E 93rd St
- 4840 E 84th St
- 4830 E 88th St
- 4821 E 85th St
- 4815 E 86th St
- 9612 Park Heights Ave
- 4903 E 94th St
- 4864 E 94th St
- 9513 David Rd