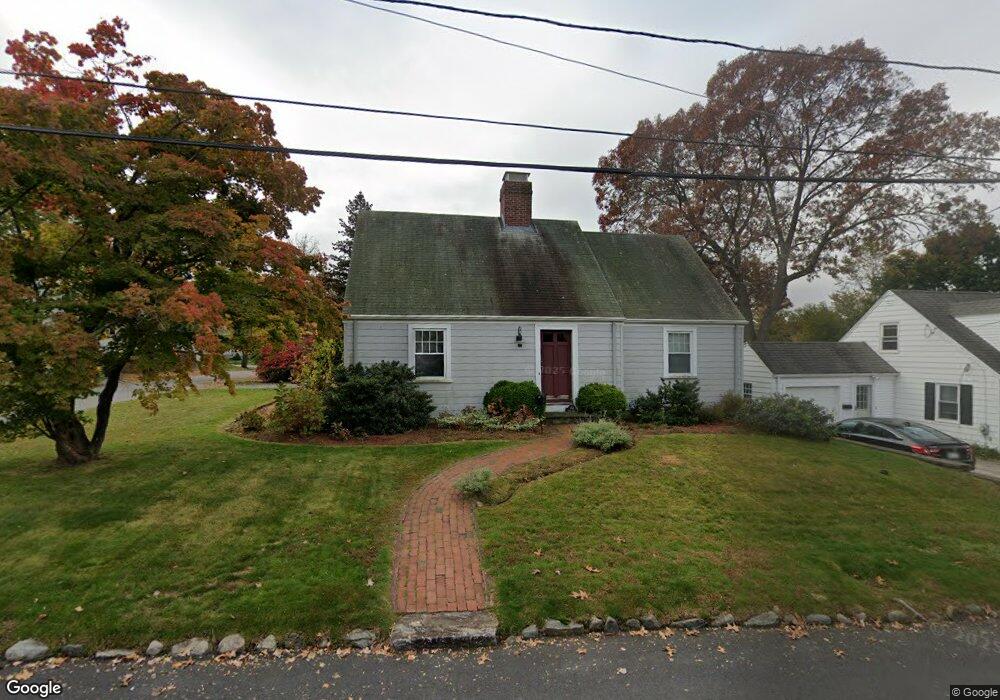
84 Bryant Rd Cranston, RI 02910
Eden Park NeighborhoodEstimated Value: $431,097 - $558,000
4
Beds
2
Baths
1,680
Sq Ft
$284/Sq Ft
Est. Value
About This Home
This home is located at 84 Bryant Rd, Cranston, RI 02910 and is currently estimated at $477,774, approximately $284 per square foot. 84 Bryant Rd is a home located in Providence County with nearby schools including Park View Middle School, Cranston High School East, and Cadence Academy Preschool - Cranston.
Ownership History
Date
Name
Owned For
Owner Type
Purchase Details
Closed on
Oct 15, 1992
Sold by
Obrien Daniel T and Obrien Gail
Bought by
Rock Deborah A
Current Estimated Value
Home Financials for this Owner
Home Financials are based on the most recent Mortgage that was taken out on this home.
Original Mortgage
$85,000
Interest Rate
7.93%
Create a Home Valuation Report for This Property
The Home Valuation Report is an in-depth analysis detailing your home's value as well as a comparison with similar homes in the area
Home Values in the Area
Average Home Value in this Area
Purchase History
| Date | Buyer | Sale Price | Title Company |
|---|---|---|---|
| Rock Deborah A | $126,000 | -- |
Source: Public Records
Mortgage History
| Date | Status | Borrower | Loan Amount |
|---|---|---|---|
| Open | Rock Deborah A | $37,000 | |
| Open | Rock Deborah A | $120,000 | |
| Closed | Rock Deborah A | $85,000 |
Source: Public Records
Tax History
| Year | Tax Paid | Tax Assessment Tax Assessment Total Assessment is a certain percentage of the fair market value that is determined by local assessors to be the total taxable value of land and additions on the property. | Land | Improvement |
|---|---|---|---|---|
| 2025 | $4,347 | $313,200 | $107,200 | $206,000 |
| 2024 | $4,263 | $313,200 | $107,200 | $206,000 |
| 2023 | $4,407 | $233,200 | $70,600 | $162,600 |
| 2022 | $4,317 | $233,200 | $70,600 | $162,600 |
| 2021 | $4,198 | $233,200 | $70,600 | $162,600 |
| 2020 | $4,223 | $203,300 | $67,200 | $136,100 |
| 2019 | $4,223 | $203,300 | $67,200 | $136,100 |
| 2018 | $4,125 | $203,300 | $67,200 | $136,100 |
| 2017 | $3,673 | $160,100 | $60,500 | $99,600 |
| 2016 | $3,594 | $160,100 | $60,500 | $99,600 |
| 2015 | $3,594 | $160,100 | $60,500 | $99,600 |
| 2014 | $3,807 | $166,700 | $60,500 | $106,200 |
Source: Public Records
Map
Nearby Homes
Your Personal Tour Guide
Ask me questions while you tour the home.