L
Seller's Agent in 2026
Laura Donohoo
Huff Realty
(937) 728-1927
1 in this area
145 Total Sales
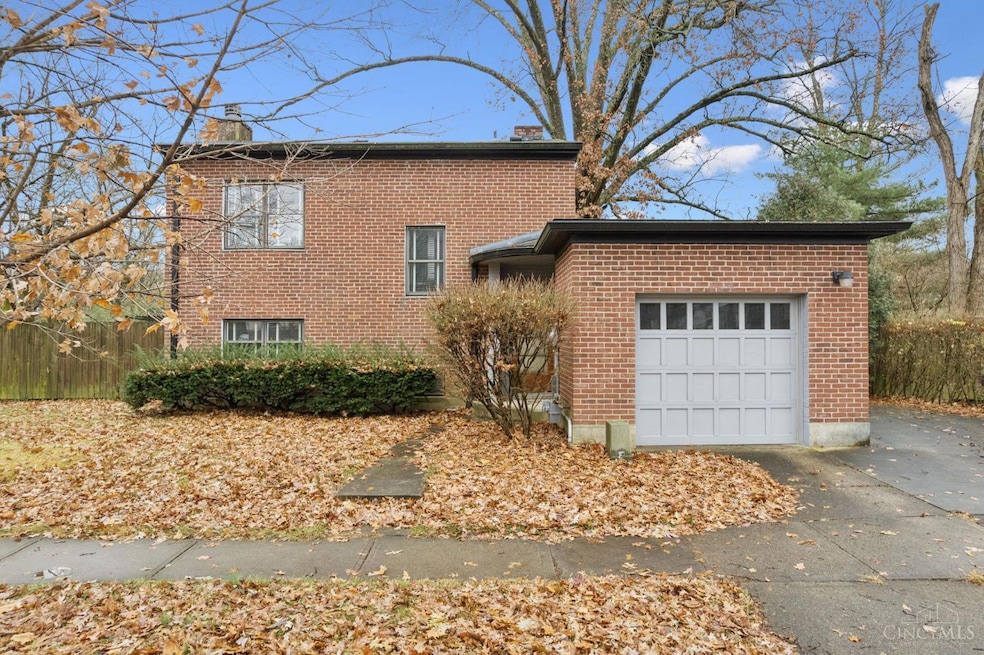
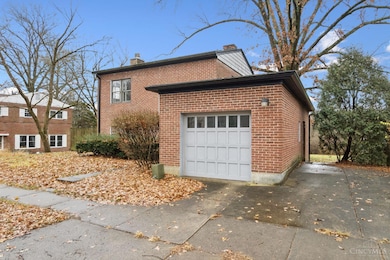
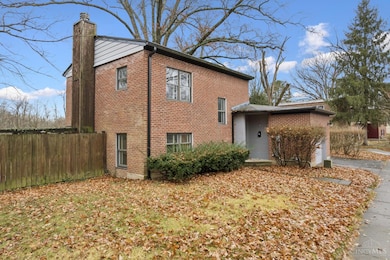
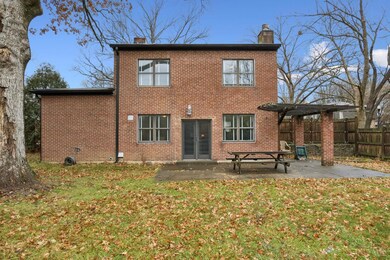
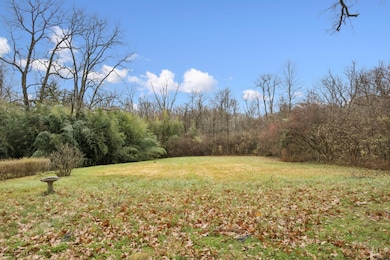
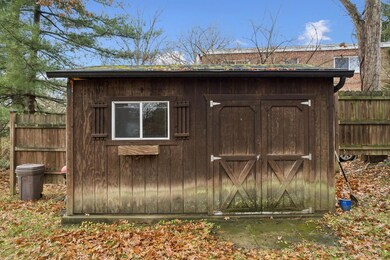
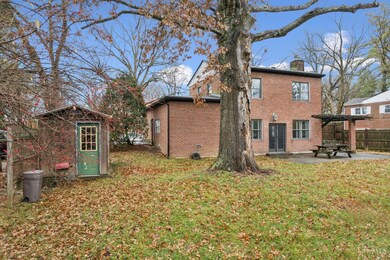
Welcome home to this charming traditional 2 story nestled in the heart of Greenhills. This mov-in ready property offers 3 comfortable bedrooms and 1.5 bathrooms, blending timeless character with modern updates. Enjoy a spacious living room filled with natural light and beautiful fireplace, an updated kitchen that walks out to a large, private backyard - perfect for 1-car garage and shed for added convenience. A rare opportunity in a sought-after neighborhood.
| Date | Type | Sale Price | Title Company |
|---|---|---|---|
| Fiduciary Deed | $195,000 | Absolute Title | |
| Warranty Deed | $71,000 | -- |
| Date | Status | Loan Amount | Loan Type |
|---|---|---|---|
| Previous Owner | $70,963 | FHA |
| Date | Event | Price | List to Sale | Price per Sq Ft |
|---|---|---|---|---|
| 01/20/2026 01/20/26 | Sold | $195,000 | +2.7% | $140 / Sq Ft |
| 12/12/2025 12/12/25 | Pending | -- | -- | -- |
| 12/11/2025 12/11/25 | For Sale | $189,900 | -- | $137 / Sq Ft |
| Year | Tax Paid | Tax Assessment Tax Assessment Total Assessment is a certain percentage of the fair market value that is determined by local assessors to be the total taxable value of land and additions on the property. | Land | Improvement |
|---|---|---|---|---|
| 2025 | $2,304 | $41,427 | $11,729 | $29,698 |
| 2024 | $2,133 | $41,427 | $11,729 | $29,698 |
| 2023 | $2,598 | $41,427 | $11,729 | $29,698 |
| 2022 | $2,397 | $28,511 | $9,800 | $18,711 |
| 2021 | $2,348 | $28,511 | $9,800 | $18,711 |
| 2020 | $2,382 | $28,511 | $9,800 | $18,711 |
| 2019 | $2,317 | $24,368 | $8,376 | $15,992 |
| 2018 | $2,322 | $24,368 | $8,376 | $15,992 |
| 2017 | $2,154 | $24,368 | $8,376 | $15,992 |
| 2016 | $2,550 | $28,281 | $9,286 | $18,995 |
| 2015 | $2,396 | $28,281 | $9,286 | $18,995 |
| 2014 | $2,452 | $28,281 | $9,286 | $18,995 |
| 2013 | $2,453 | $29,156 | $9,573 | $19,583 |
L
Seller's Agent in 2026
Laura Donohoo
Huff Realty
(937) 728-1927
1 in this area
145 Total Sales
K
Seller Co-Listing Agent in 2026
Kelly Lewis
Huff Realty
(513) 502-4898
1 in this area
127 Total Sales

Buyer's Agent in 2026
Rachel Jouett
Plum Tree Realty
(513) 692-7894
2 in this area
15 Total Sales
Source: MLS of Greater Cincinnati (CincyMLS)
MLS Number: 1863952
APN: 597-0080-0013
Disclaimer: Certain information contained herein is derived from information provided by parties other than Homes.com. All information provided is deemed reliable, but is not guaranteed to be accurate and should be independently verified.
![]() The data relating to real estate for sale on this website comes in part from the Broker Reciprocity programs of the MLS of Greater Cincinnati, Inc.. Those listings held by brokerage firms other than Ten-X are marked with the Broker Reciprocity logo and house icon. The properties displayed may not be all of the properties available through Broker Reciprocity.
The data relating to real estate for sale on this website comes in part from the Broker Reciprocity programs of the MLS of Greater Cincinnati, Inc.. Those listings held by brokerage firms other than Ten-X are marked with the Broker Reciprocity logo and house icon. The properties displayed may not be all of the properties available through Broker Reciprocity.
IDX information is provided exclusively for personal, non-commercial use, and may not be used for any purpose other than to identify prospective properties consumers may be interested in purchasing.
Information is deemed reliable but not guaranteed.
Ten-X does not display the entire Cincinnati MLS Broker Reciprocity™ database on this web site. The listings of some real estate brokerage firms have been excluded.
Copyright 2026, MLS of Greater Cincinnati, Inc. All rights reserved
Ask me questions while you tour the home.