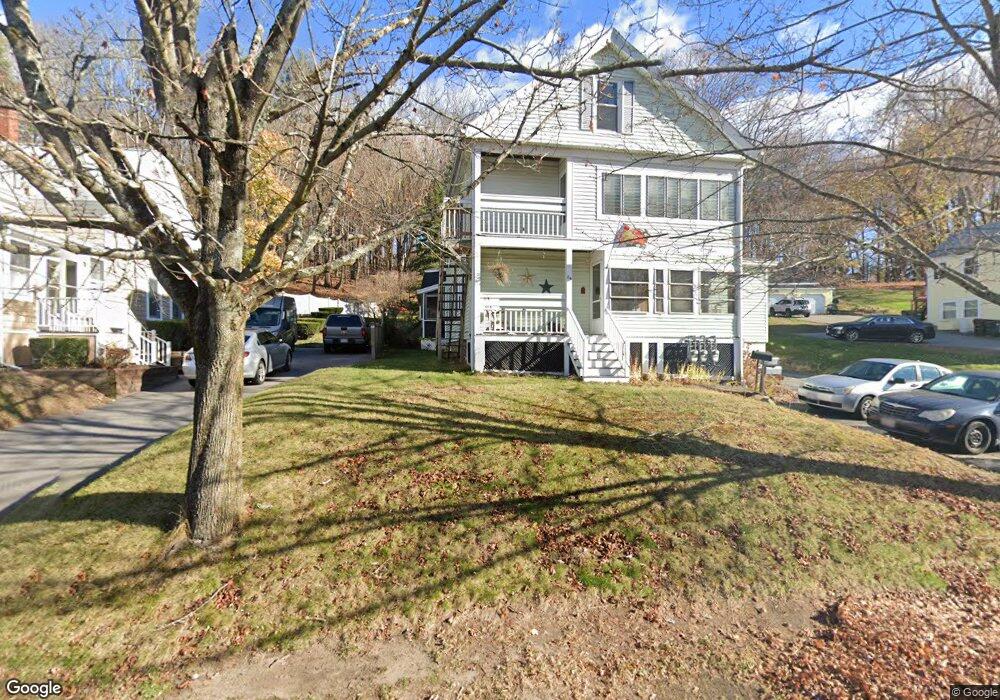
84 Congress St Amesbury, MA 01913
Estimated Value: $524,000 - $683,473
4
Beds
3
Baths
2,216
Sq Ft
$279/Sq Ft
Est. Value
About This Home
This home is located at 84 Congress St, Amesbury, MA 01913 and is currently estimated at $618,118, approximately $278 per square foot. 84 Congress St is a home located in Essex County with nearby schools including Amesbury High School and Amesbury Seventh-Day Adventist School.
Ownership History
Date
Name
Owned For
Owner Type
Purchase Details
Closed on
Jun 18, 2025
Sold by
Deguio Craig
Bought by
Cahill Payson
Current Estimated Value
Home Financials for this Owner
Home Financials are based on the most recent Mortgage that was taken out on this home.
Original Mortgage
$465,000
Outstanding Balance
$463,795
Interest Rate
6.76%
Mortgage Type
Purchase Money Mortgage
Estimated Equity
$154,323
Purchase Details
Closed on
May 28, 2021
Sold by
Dck Rt
Bought by
Deguio Craig
Home Financials for this Owner
Home Financials are based on the most recent Mortgage that was taken out on this home.
Original Mortgage
$339,000
Interest Rate
3%
Mortgage Type
Purchase Money Mortgage
Create a Home Valuation Report for This Property
The Home Valuation Report is an in-depth analysis detailing your home's value as well as a comparison with similar homes in the area
Home Values in the Area
Average Home Value in this Area
Purchase History
| Date | Buyer | Sale Price | Title Company |
|---|---|---|---|
| Cahill Payson | $620,000 | None Available | |
| Cahill Payson | $620,000 | None Available | |
| Deguio Craig | $600,000 | None Available | |
| Deguio Craig | $600,000 | None Available |
Source: Public Records
Mortgage History
| Date | Status | Borrower | Loan Amount |
|---|---|---|---|
| Open | Cahill Payson | $465,000 | |
| Closed | Cahill Payson | $465,000 | |
| Previous Owner | Deguio Craig | $339,000 |
Source: Public Records
Tax History Compared to Growth
Tax History
| Year | Tax Paid | Tax Assessment Tax Assessment Total Assessment is a certain percentage of the fair market value that is determined by local assessors to be the total taxable value of land and additions on the property. | Land | Improvement |
|---|---|---|---|---|
| 2025 | $8,658 | $565,900 | $219,200 | $346,700 |
| 2024 | $8,544 | $546,300 | $206,900 | $339,400 |
| 2023 | $8,484 | $519,200 | $179,800 | $339,400 |
| 2022 | $7,539 | $426,200 | $156,400 | $269,800 |
| 2021 | $7,902 | $433,000 | $120,700 | $312,300 |
| 2020 | $7,075 | $411,800 | $116,100 | $295,700 |
| 2019 | $6,077 | $330,800 | $116,100 | $214,700 |
| 2018 | $5,625 | $296,200 | $110,500 | $185,700 |
| 2017 | $5,660 | $283,700 | $110,500 | $173,200 |
| 2016 | $5,579 | $275,100 | $110,500 | $164,600 |
| 2015 | $5,679 | $276,500 | $110,500 | $166,000 |
| 2014 | $5,798 | $276,500 | $110,500 | $166,000 |
Source: Public Records
Map
Nearby Homes
- 100 Congress St
- 7 Melrose St
- 22 Huntington Ave
- 25 Cedar St Unit 7
- 105 Market St Unit B
- 103 Market St Unit A
- 103 Market St Unit B
- 101 Market St Unit B
- 101 Market St Unit A
- 1 Stacey Ln
- 97 Elm St
- 57 Clinton St
- 5 Richs Ct Unit 3
- 53 Market St
- 161 Elm St Unit A
- 3 Glenwood St
- 15 Atlantic Ave
- 17 Linwood Place
- 179 Elm St
- 3 Brown Ave Unit 75