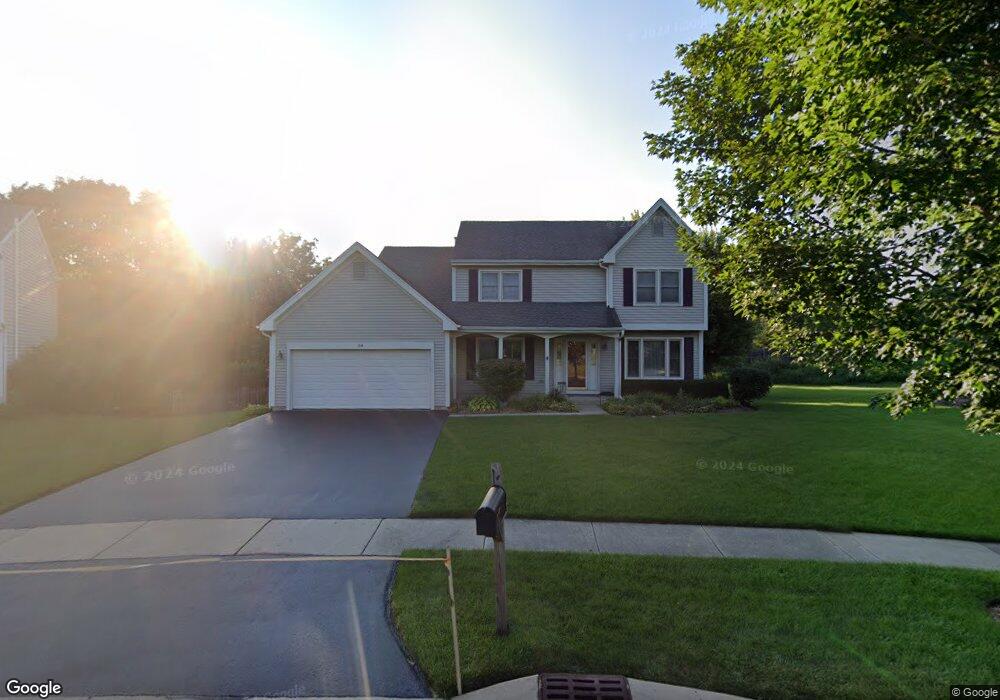
84 Foxboro Ln Unit 3 Gurnee, IL 60031
Estimated Value: $430,000 - $458,000
4
Beds
3
Baths
2,299
Sq Ft
$193/Sq Ft
Est. Value
About This Home
This home is located at 84 Foxboro Ln Unit 3, Gurnee, IL 60031 and is currently estimated at $444,372, approximately $193 per square foot. 84 Foxboro Ln Unit 3 is a home located in Lake County with nearby schools including Woodland Primary School, Woodland Elementary School, and Woodland Intermediate School.
Ownership History
Date
Name
Owned For
Owner Type
Purchase Details
Closed on
Mar 16, 2004
Sold by
Schafman Merle and Schafman Laura
Bought by
Ditmars Donald M and Ditmars Laurie A
Current Estimated Value
Home Financials for this Owner
Home Financials are based on the most recent Mortgage that was taken out on this home.
Original Mortgage
$180,000
Outstanding Balance
$84,536
Interest Rate
5.74%
Mortgage Type
Purchase Money Mortgage
Estimated Equity
$359,836
Purchase Details
Closed on
Feb 9, 2001
Sold by
Fox Kevin F and Fox Amy B
Bought by
Schafman Merle and Schafman Laura
Home Financials for this Owner
Home Financials are based on the most recent Mortgage that was taken out on this home.
Original Mortgage
$163,500
Interest Rate
7.1%
Purchase Details
Closed on
Jul 31, 1995
Sold by
Perkins Thomas W and Perkins Mary Letha
Bought by
Fox Kevin F and Kennedy Amy B
Home Financials for this Owner
Home Financials are based on the most recent Mortgage that was taken out on this home.
Original Mortgage
$180,500
Interest Rate
7.61%
Create a Home Valuation Report for This Property
The Home Valuation Report is an in-depth analysis detailing your home's value as well as a comparison with similar homes in the area
Home Values in the Area
Average Home Value in this Area
Purchase History
| Date | Buyer | Sale Price | Title Company |
|---|---|---|---|
| Ditmars Donald M | $312,000 | First American Title | |
| Schafman Merle | $233,666 | First American Title | |
| Fox Kevin F | $190,000 | First American Title |
Source: Public Records
Mortgage History
| Date | Status | Borrower | Loan Amount |
|---|---|---|---|
| Open | Ditmars Donald M | $180,000 | |
| Previous Owner | Schafman Merle | $163,500 | |
| Previous Owner | Fox Kevin F | $180,500 |
Source: Public Records
Tax History Compared to Growth
Tax History
| Year | Tax Paid | Tax Assessment Tax Assessment Total Assessment is a certain percentage of the fair market value that is determined by local assessors to be the total taxable value of land and additions on the property. | Land | Improvement |
|---|---|---|---|---|
| 2024 | $10,648 | $125,322 | $21,080 | $104,242 |
| 2023 | $10,586 | $116,351 | $19,571 | $96,780 |
| 2022 | $10,586 | $114,602 | $21,892 | $92,710 |
| 2021 | $9,568 | $110,004 | $21,014 | $88,990 |
| 2020 | $9,259 | $107,300 | $20,497 | $86,803 |
| 2019 | $8,995 | $104,185 | $19,902 | $84,283 |
| 2018 | $8,855 | $103,887 | $22,367 | $81,520 |
| 2017 | $8,761 | $100,910 | $21,726 | $79,184 |
| 2016 | $8,691 | $96,417 | $20,759 | $75,658 |
| 2015 | $8,464 | $91,443 | $19,688 | $71,755 |
| 2014 | $8,536 | $92,788 | $19,452 | $73,336 |
| 2012 | $8,090 | $93,499 | $19,601 | $73,898 |
Source: Public Records
Map
Nearby Homes
- 295 N Hunt Club Rd
- 6402 Barn Swallow Ct
- 6191 Oakmont Ln
- 6161 Oakmont Ln
- 17404 W Walnut Ln Unit 2C
- 6296 Doral Dr
- 6359 Doral Dr
- 34040 N White Oak Ln Unit 46C
- 17429 W Chestnut Ln Unit 13A
- 17119 W Prairieview Ln
- 16978 W Orchard Valley Dr
- 17514 W Bridle Ct
- 17444 Pin Oak Ln
- 6091 Washington St
- 17150 Washington St
- 17490 Pin Oak Ln
- 6409 Davidson Ct
- 6401 Davidson Ct
- 35051 N Oak Knoll Cir
- 650 Whitney Ct Unit 108
- 80 Foxboro Ln
- 88 Foxboro Ln Unit 3
- 6261 Washington St
- 92 Foxboro Ln
- 79 Foxboro Ln
- 76 Foxboro Ln
- 96 Foxboro Ln
- 6289 Winchester Ct
- 95 Foxboro Ln
- 6316 Old Farm Ln Unit 7
- 6328 Old Farm Ln
- 6301 Winchester Ct
- 81 Silo Ct
- 100 Foxboro Ln
- 6277 Winchester Ct
- 85 Silo Ct
- 72 Foxboro Ln
- 75 Foxboro Ln
- 16796 W Washington St
- 89 Silo Ct