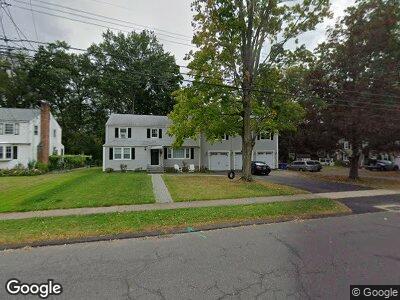
84 Overbrook Rd West Hartford, CT 06107
Estimated Value: $489,000 - $529,000
4
Beds
2
Baths
1,907
Sq Ft
$270/Sq Ft
Est. Value
About This Home
This home is located at 84 Overbrook Rd, West Hartford, CT 06107 and is currently estimated at $513,970, approximately $269 per square foot. 84 Overbrook Rd is a home located in Hartford County with nearby schools including Webster Hill School, Sedgwick Middle School, and Conard High School.
Ownership History
Date
Name
Owned For
Owner Type
Purchase Details
Closed on
Feb 26, 2018
Sold by
Armstrong Jill C
Bought by
Armstrong Nathan J
Current Estimated Value
Home Financials for this Owner
Home Financials are based on the most recent Mortgage that was taken out on this home.
Original Mortgage
$246,000
Interest Rate
3.99%
Mortgage Type
Credit Line Revolving
Purchase Details
Closed on
Nov 16, 2011
Sold by
Laura B Matties T
Bought by
Armstrong Nathan J and Armstrong Jill C
Home Financials for this Owner
Home Financials are based on the most recent Mortgage that was taken out on this home.
Original Mortgage
$204,250
Interest Rate
3.92%
Purchase Details
Closed on
Apr 19, 1990
Sold by
Rsk Kellco Inc
Bought by
Hornat Thomas
Home Financials for this Owner
Home Financials are based on the most recent Mortgage that was taken out on this home.
Original Mortgage
$175,000
Interest Rate
10.21%
Create a Home Valuation Report for This Property
The Home Valuation Report is an in-depth analysis detailing your home's value as well as a comparison with similar homes in the area
Home Values in the Area
Average Home Value in this Area
Purchase History
| Date | Buyer | Sale Price | Title Company |
|---|---|---|---|
| Armstrong Nathan J | -- | -- | |
| Armstrong Nathan J | $215,000 | -- | |
| Hornat Thomas | $225,000 | -- |
Source: Public Records
Mortgage History
| Date | Status | Borrower | Loan Amount |
|---|---|---|---|
| Open | Armstrong Nathan J | $70,000 | |
| Open | Armstrong Nathan J | $243,000 | |
| Closed | Armstrong Nathan J | $246,000 | |
| Previous Owner | Armstrong Nathan J | $250,000 | |
| Previous Owner | Hornat Thomas | $45,700 | |
| Previous Owner | Hornat Thomas | $204,250 | |
| Previous Owner | Hornat Thomas | $175,000 |
Source: Public Records
Tax History Compared to Growth
Tax History
| Year | Tax Paid | Tax Assessment Tax Assessment Total Assessment is a certain percentage of the fair market value that is determined by local assessors to be the total taxable value of land and additions on the property. | Land | Improvement |
|---|---|---|---|---|
| 2024 | $10,062 | $237,580 | $83,160 | $154,420 |
| 2023 | $9,722 | $237,580 | $83,160 | $154,420 |
| 2022 | $9,665 | $237,580 | $83,160 | $154,420 |
| 2021 | $9,537 | $224,820 | $76,700 | $148,120 |
| 2020 | $8,872 | $212,240 | $71,400 | $140,840 |
| 2019 | $8,872 | $212,240 | $71,400 | $140,840 |
| 2018 | $8,702 | $212,240 | $71,400 | $140,840 |
| 2017 | $8,661 | $211,050 | $71,400 | $139,650 |
| 2016 | $6,591 | $166,810 | $54,670 | $112,140 |
| 2015 | $6,390 | $166,810 | $54,670 | $112,140 |
| 2014 | $6,150 | $164,570 | $54,670 | $109,900 |
Source: Public Records
Map
Nearby Homes
- 46 Glenbrook Rd
- 101 White Ave
- 33 Woodmere Rd
- 34 Bonny View Rd
- 30 Bonny View Rd
- 595 Park Rd
- 36 Bentwood Rd
- 184 S Main St
- 594 Quaker Ln S
- 136 Edgemere Ave
- 134 Saint Charles St
- 253 S Main St
- 60 Dartmouth Ave
- 770 Trout Brook Dr
- 79 Pheasant Hill Dr
- 386 Park Rd
- 90 Bentwood Rd
- 14 Chamberlin Dr
- 104 Vera St
- 94 Vera St
- 84 Overbrook Rd
- 82 Overbrook Rd
- 88 Overbrook Rd
- 78 Overbrook Rd
- 92 Overbrook Rd
- 76 Overbrook Rd
- 4 Crestwood Rd
- 83 Overbrook Rd
- 94 Overbrook Rd
- 3 Crestwood Rd
- 81 Overbrook Rd
- 77 Overbrook Rd
- 93 Overbrook Rd
- 96 Overbrook Rd
- 75 Overbrook Rd
- 70 Overbrook Rd
- 97 Overbrook Rd
- 100 Overbrook Rd
- 7 Crestwood Rd
- 12 Crestwood Rd