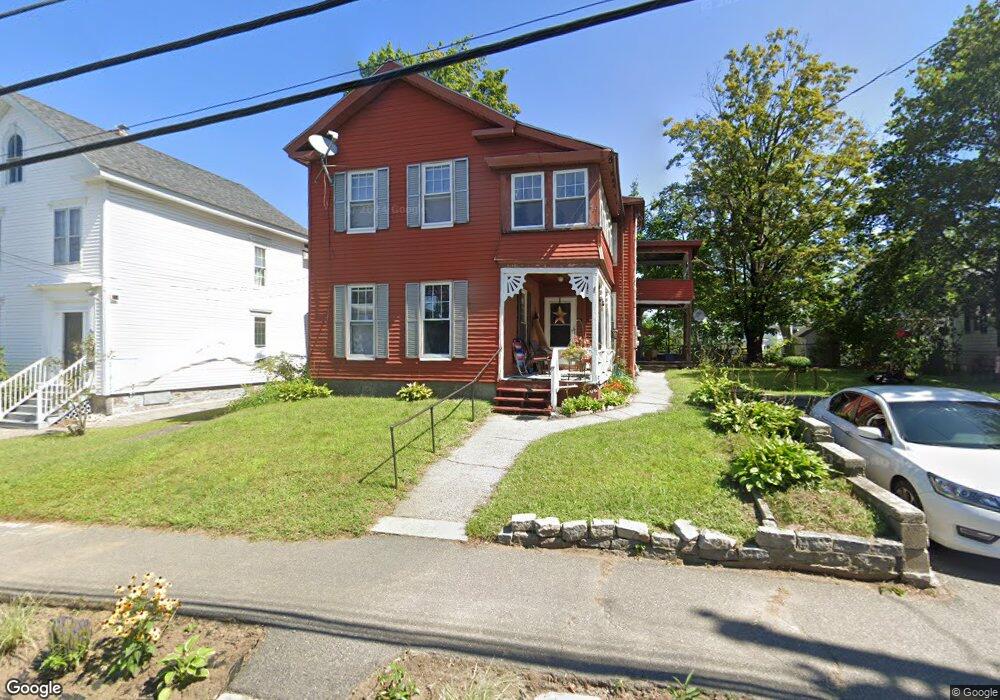
84 Rumford St Concord, NH 03301
North End NeighborhoodEstimated Value: $414,129 - $543,000
5
Beds
2
Baths
2,670
Sq Ft
$180/Sq Ft
Est. Value
About This Home
This home is located at 84 Rumford St, Concord, NH 03301 and is currently estimated at $480,032, approximately $179 per square foot. 84 Rumford St is a home located in Merrimack County with nearby schools including Christa McAuliffe School, Rundlett Middle School, and Concord High School.
Ownership History
Date
Name
Owned For
Owner Type
Purchase Details
Closed on
May 14, 2003
Sold by
North Peakcom Corp
Bought by
Hode Hanna John F and Hode Hanna
Current Estimated Value
Home Financials for this Owner
Home Financials are based on the most recent Mortgage that was taken out on this home.
Original Mortgage
$173,200
Outstanding Balance
$75,550
Interest Rate
5.84%
Mortgage Type
Purchase Money Mortgage
Estimated Equity
$404,482
Purchase Details
Closed on
Sep 27, 1996
Sold by
Lamothe Denise C
Bought by
North Peak Com Corp
Create a Home Valuation Report for This Property
The Home Valuation Report is an in-depth analysis detailing your home's value as well as a comparison with similar homes in the area
Home Values in the Area
Average Home Value in this Area
Purchase History
| Date | Buyer | Sale Price | Title Company |
|---|---|---|---|
| Hode Hanna John F | $216,500 | -- | |
| North Peak Com Corp | $82,500 | -- |
Source: Public Records
Mortgage History
| Date | Status | Borrower | Loan Amount |
|---|---|---|---|
| Open | North Peak Com Corp | $173,200 |
Source: Public Records
Tax History Compared to Growth
Tax History
| Year | Tax Paid | Tax Assessment Tax Assessment Total Assessment is a certain percentage of the fair market value that is determined by local assessors to be the total taxable value of land and additions on the property. | Land | Improvement |
|---|---|---|---|---|
| 2024 | $7,983 | $288,300 | $99,700 | $188,600 |
| 2023 | $7,744 | $288,300 | $99,700 | $188,600 |
| 2022 | $7,464 | $288,300 | $99,700 | $188,600 |
| 2021 | $7,832 | $311,800 | $99,700 | $212,100 |
| 2020 | $7,273 | $271,800 | $79,600 | $192,200 |
| 2019 | $7,087 | $255,100 | $75,300 | $179,800 |
| 2018 | $8,246 | $292,500 | $70,900 | $221,600 |
| 2017 | $7,893 | $279,500 | $68,700 | $210,800 |
| 2016 | $7,072 | $255,600 | $68,700 | $186,900 |
| 2015 | $6,154 | $225,100 | $63,700 | $161,400 |
| 2014 | $6,035 | $225,100 | $63,700 | $161,400 |
| 2013 | $5,367 | $209,800 | $63,700 | $146,100 |
| 2012 | $4,718 | $193,600 | $63,700 | $129,900 |
Source: Public Records
Map
Nearby Homes